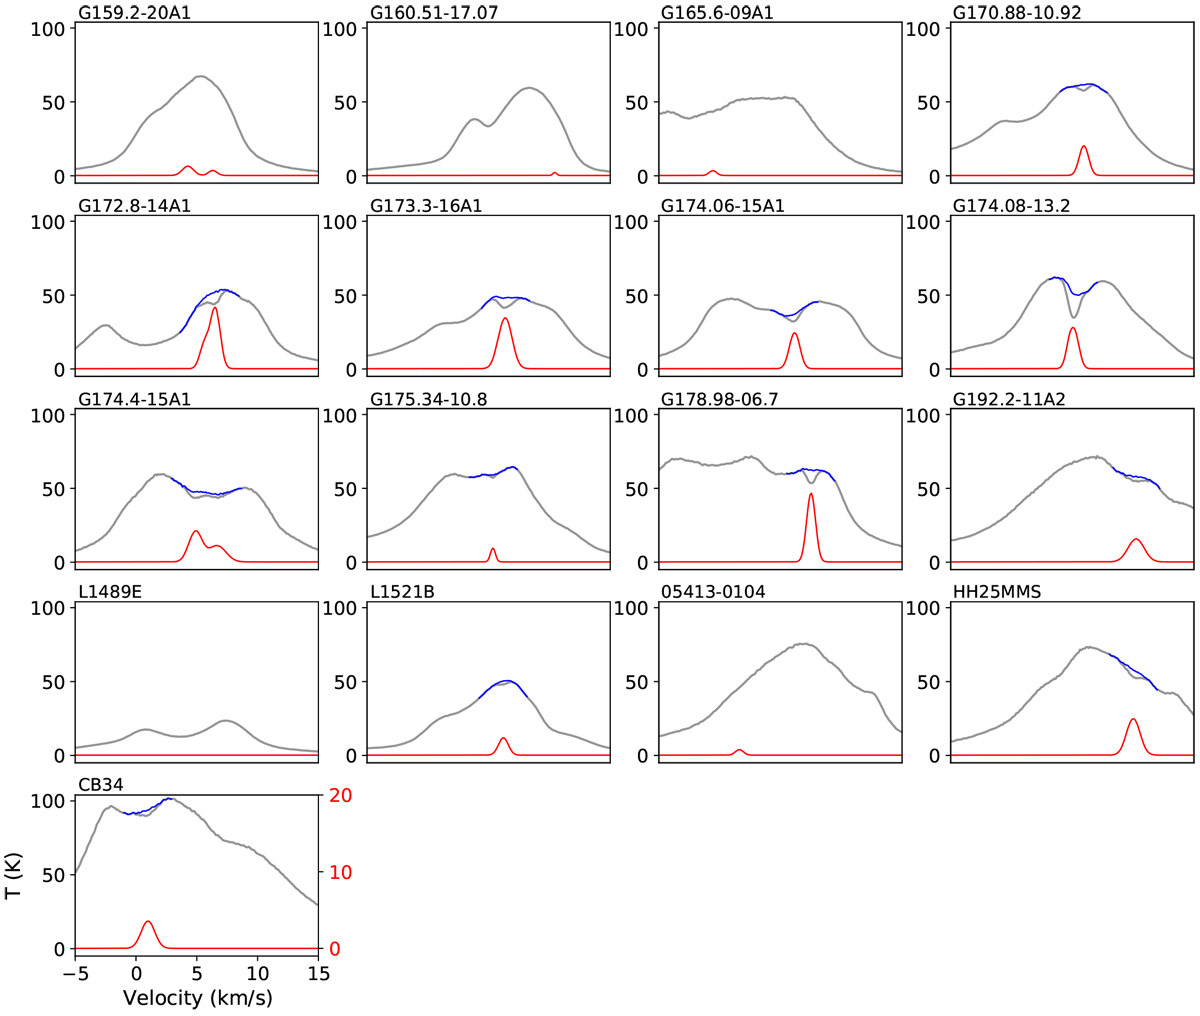
Fig. 7
Download original image
H I 21 cm spectra at the center beam. In each panel, the gray line is the observed spectrum Tr, the blue line is the recovered TH I using method 2, and the red line is Tab. Values of Tab on the y-axis range from 0 to 20 K for all sources except G174.08-13.2, which uses 0–60 K. The orange and blue squares represent the sources that can and cannot be successfully fit using method 1. The blue line is not shown for spectrum with fit τ smaller than 0.01.
Current usage metrics show cumulative count of Article Views (full-text article views including HTML views, PDF and ePub downloads, according to the available data) and Abstracts Views on Vision4Press platform.
Data correspond to usage on the plateform after 2015. The current usage metrics is available 48-96 hours after online publication and is updated daily on week days.
Initial download of the metrics may take a while.