Fig. 5
Download original image
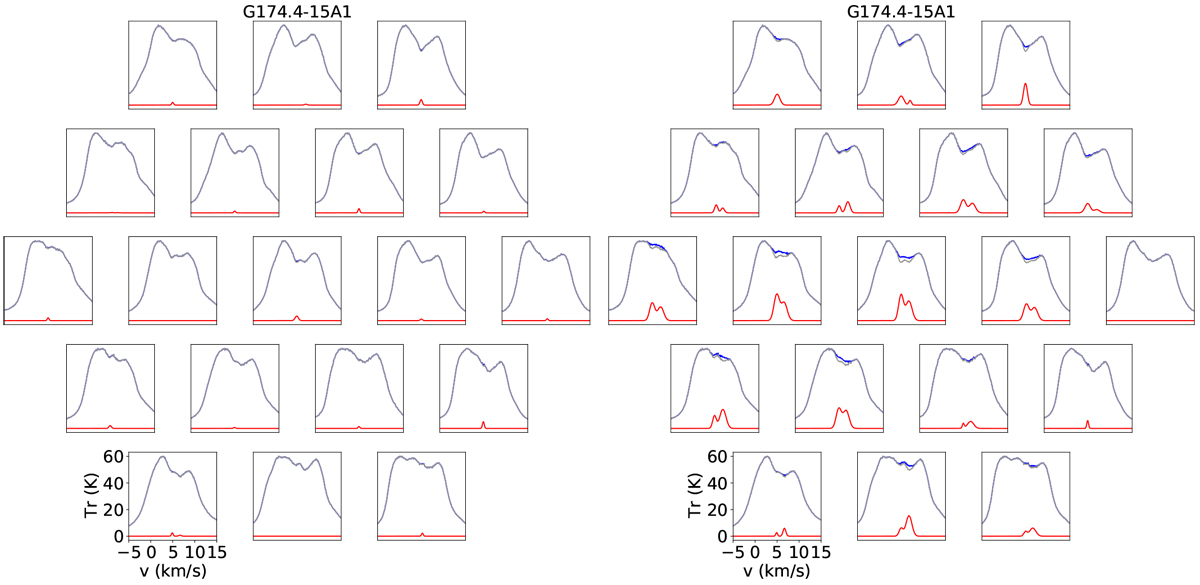
HINSA features of G174.4-15A1 extracted by method 1 (left) and method 2 (right). Method 1 fails to fit the HINSA component because of the low S/N and the blending of two absorption components with similar velocities. In each panel, the gray line is the observed spectrum Tr, the blue line is the recovered TH I, and the red line is Tab. The Tab shown here has been multiplied by a factor of five.
Current usage metrics show cumulative count of Article Views (full-text article views including HTML views, PDF and ePub downloads, according to the available data) and Abstracts Views on Vision4Press platform.
Data correspond to usage on the plateform after 2015. The current usage metrics is available 48-96 hours after online publication and is updated daily on week days.
Initial download of the metrics may take a while.