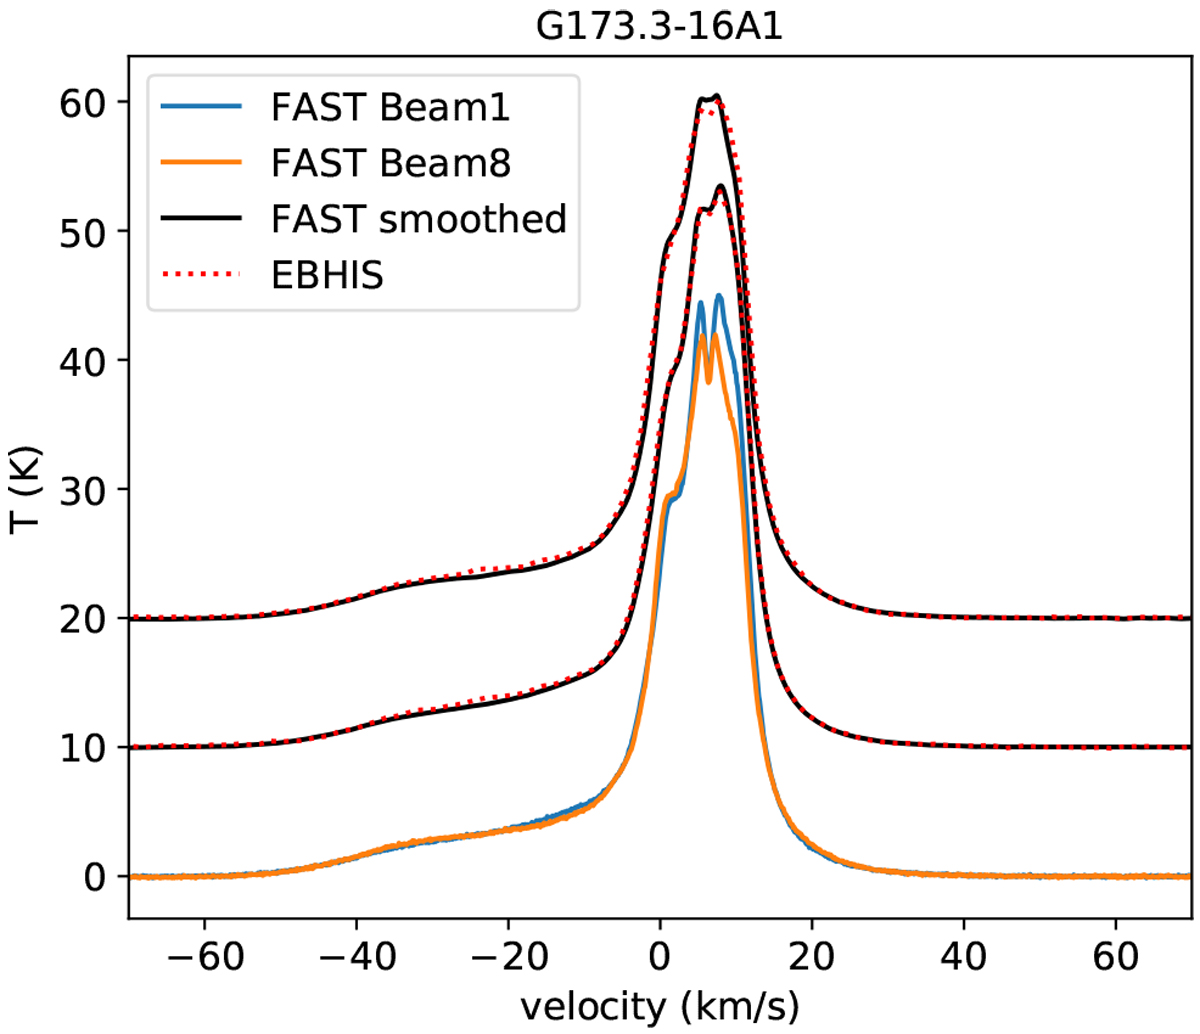
Fig. 3
Download original image
Blue and orange solid line are the H I 21 cm spectra obtained by the FAST beam 1 and beam 8, respectively. The spectra werecalibrated adopting a beam efficiency of 0.85 for extended source. The red dotted lines are the spectra from the EBHIS (Winkel et al. 2016). The black solid lines are the FAST H I 21 cm spectra smoothed to have a velocity resolution similar to that of the EBHIS spectrum. To avoid overlapping, the red dotted lines and the black solid lines have been moved up by 10 and 20 K for beam 1 and beam 8, respectively.
Current usage metrics show cumulative count of Article Views (full-text article views including HTML views, PDF and ePub downloads, according to the available data) and Abstracts Views on Vision4Press platform.
Data correspond to usage on the plateform after 2015. The current usage metrics is available 48-96 hours after online publication and is updated daily on week days.
Initial download of the metrics may take a while.