Fig. 17
Download original image
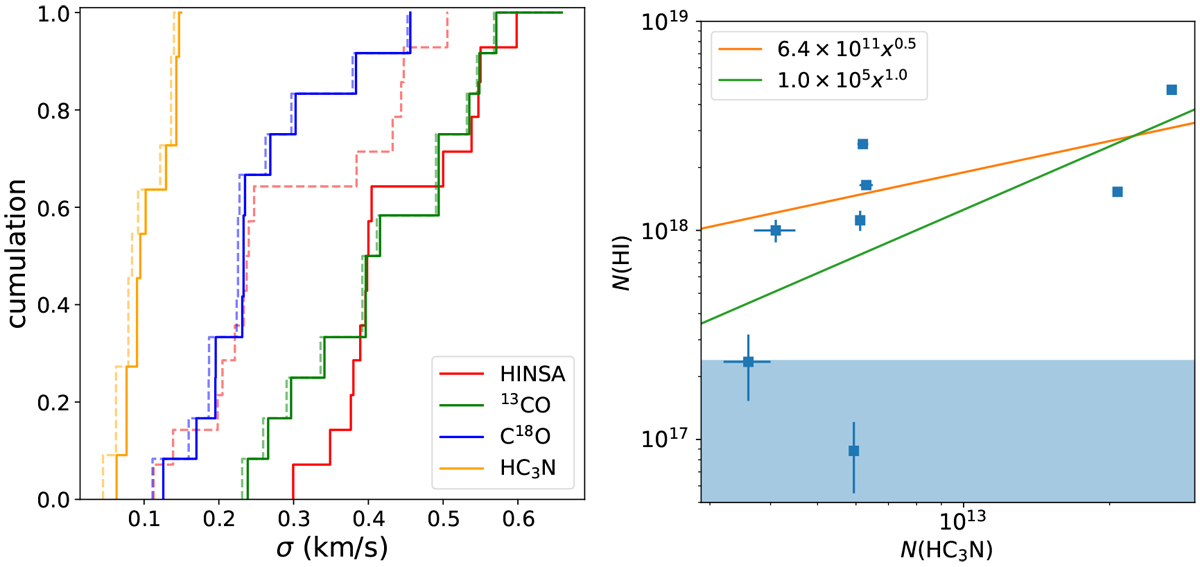
Comparisons between the velocity dispersions and column densities of HC3N and H I. Left: cumulative distributions of velocity dispersions. Solid lines and dashed lines represent σ and σNT, respectively (Sect. 6.5). Right: correlation between the column densities of H I and those of HC3N. Green and orange lines represent the linear fitting with and without the two data in blue shadowing, respectively. For data in the blue shadowing, the N(H I) parameters are not reliable with regard to the fit optical depth of HINSA τ < 0.01 (Sect. 5.2.5).
Current usage metrics show cumulative count of Article Views (full-text article views including HTML views, PDF and ePub downloads, according to the available data) and Abstracts Views on Vision4Press platform.
Data correspond to usage on the plateform after 2015. The current usage metrics is available 48-96 hours after online publication and is updated daily on week days.
Initial download of the metrics may take a while.