Free Access
Fig. 16
Download original image
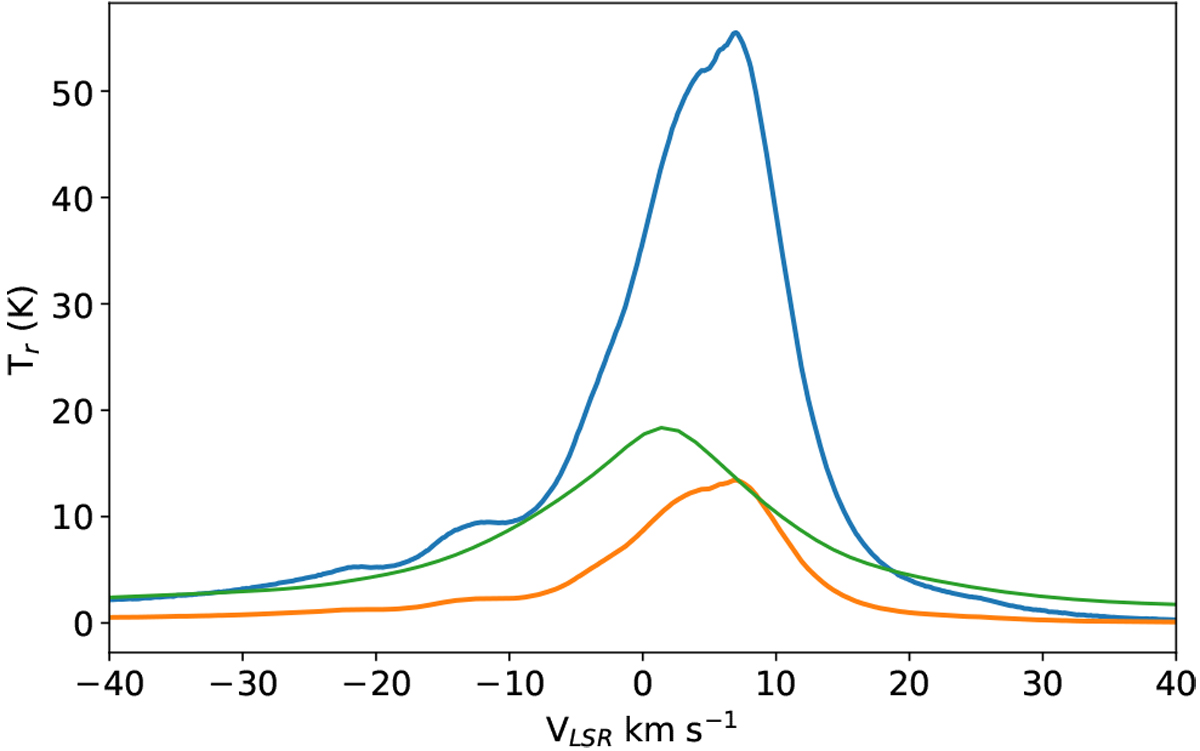
Blue line: average H I spectrum of the observed sources in this work. Orange line:
![]() estimated bymultiplying the blue line by sin(14°). Green line:
estimated bymultiplying the blue line by sin(14°). Green line: ![]() evaluated from the full-sky H I survey HI4PI based on EBHIS and GASS (HI4PI Collaboration 2016).
evaluated from the full-sky H I survey HI4PI based on EBHIS and GASS (HI4PI Collaboration 2016).
Current usage metrics show cumulative count of Article Views (full-text article views including HTML views, PDF and ePub downloads, according to the available data) and Abstracts Views on Vision4Press platform.
Data correspond to usage on the plateform after 2015. The current usage metrics is available 48-96 hours after online publication and is updated daily on week days.
Initial download of the metrics may take a while.