Free Access
Fig. 15
Download original image
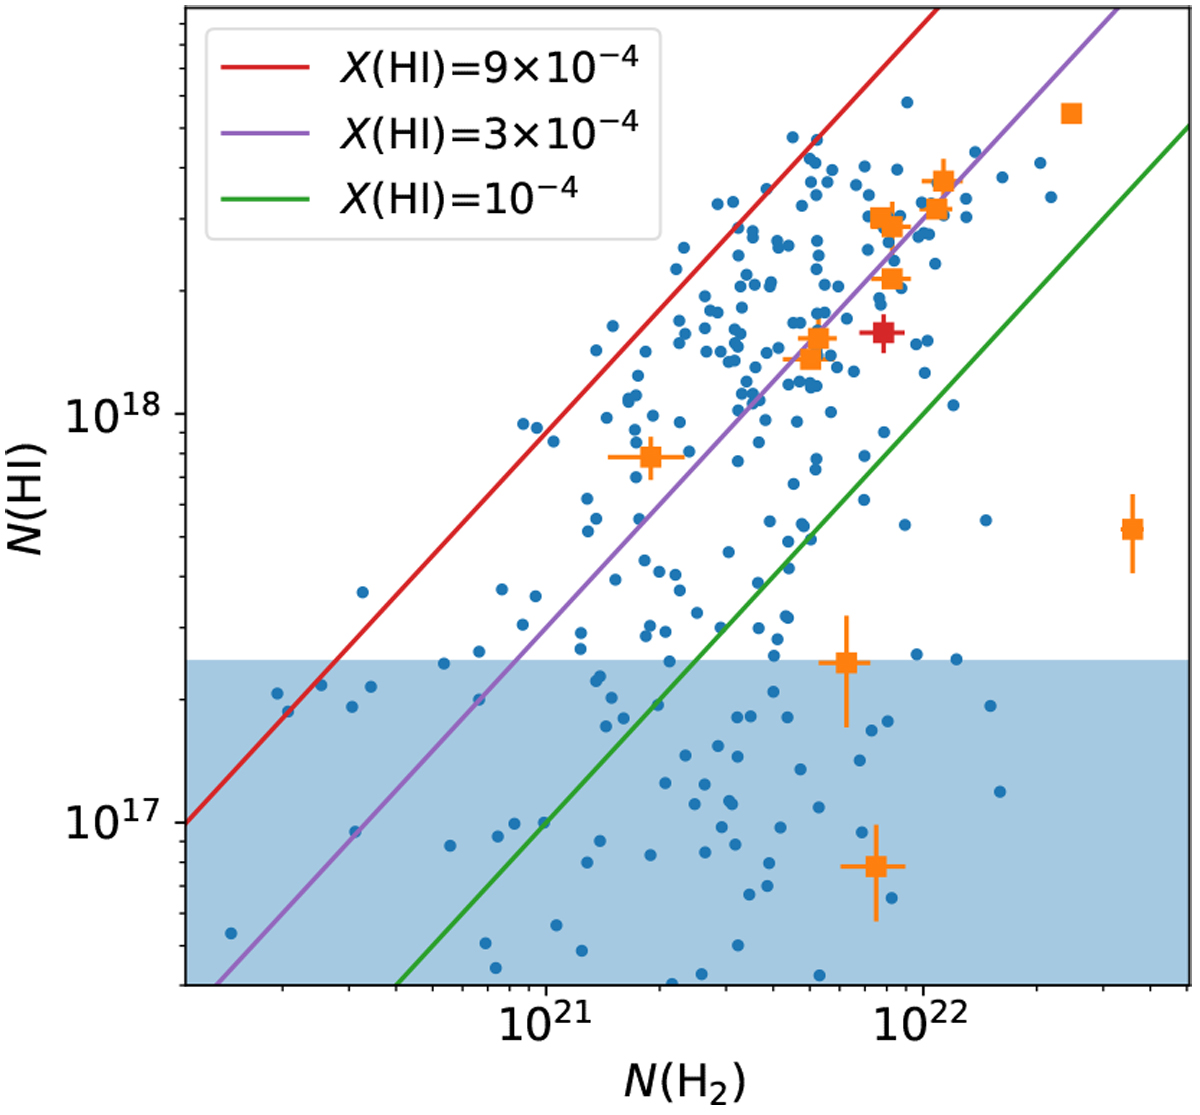
Correlation between the column densities of H I and those of H2 derived fromC18O J = 1–0 emission. The orange squares represent the data of the central beams. The blue dots represent the data of other beams. The red square shows the data at the peak position of the HINSA map of G165.6-09A1.
Current usage metrics show cumulative count of Article Views (full-text article views including HTML views, PDF and ePub downloads, according to the available data) and Abstracts Views on Vision4Press platform.
Data correspond to usage on the plateform after 2015. The current usage metrics is available 48-96 hours after online publication and is updated daily on week days.
Initial download of the metrics may take a while.