Fig. 14
Download original image
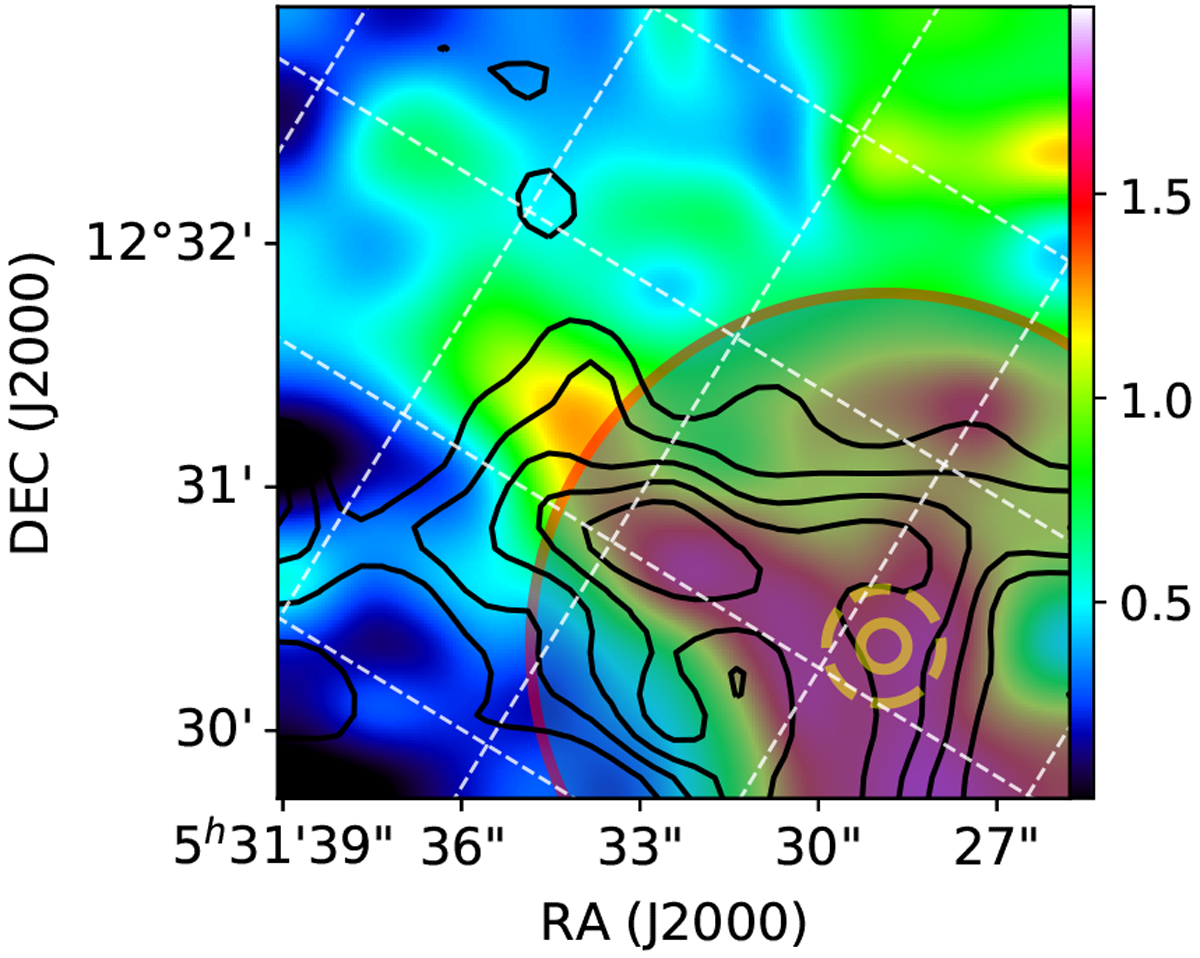
Cutout region of G192.2-11A2 represented by the black box in Fig. 9f. The background and black contours present the emissions of C18O J = 2–1 and HCO+ J = 1–0 measured with the IRAM 30 m telescope (Xu et al., in prep.), respectively. The contours have levels from 0.5 to 0.9 stepped by 0.1 in unit of K km s−1. The red circle shows the location of the central beam of the H I observation. The yellow dashed circle and solid circle represent the beam size of HCO+ J = 1–0 and C18O J = 2–1, respectively. The white dashed lines are the grid lines of the Galactic coordinate.
Current usage metrics show cumulative count of Article Views (full-text article views including HTML views, PDF and ePub downloads, according to the available data) and Abstracts Views on Vision4Press platform.
Data correspond to usage on the plateform after 2015. The current usage metrics is available 48-96 hours after online publication and is updated daily on week days.
Initial download of the metrics may take a while.