Fig. 1
Download original image
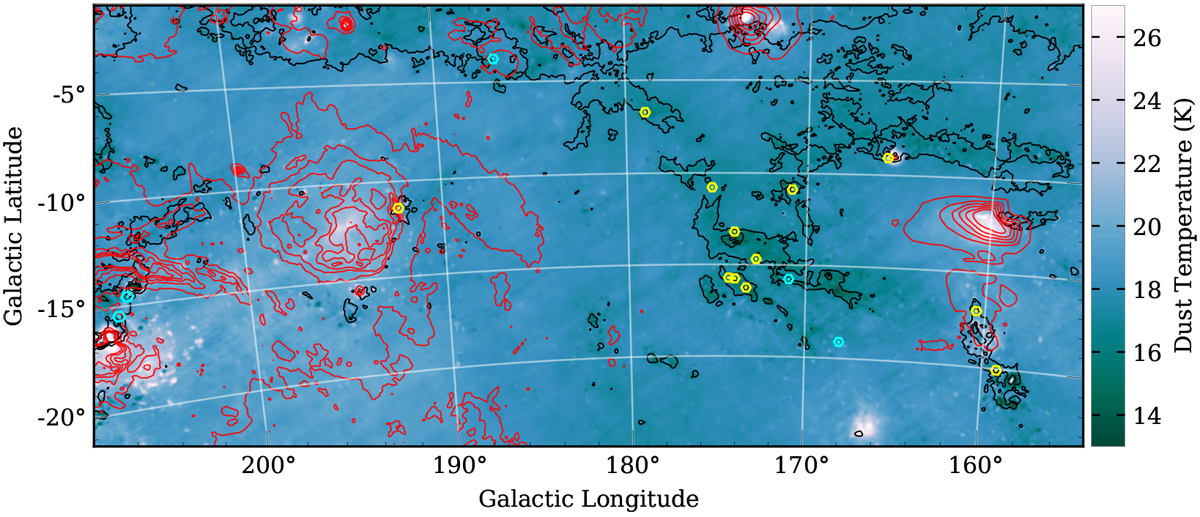
Galactic longitude-latitude positions of the 17 sources in our sample. Yellow and cyan hexagons represent the 12 PGCCs and the other five sources, respectively. The size of the hexagon represents the covering area of the 19-beam receiver of the FAST. The dot within each hexagon shows targeted locations of the central beam (Beam 1; Fig. 2). The background image shows Planck dust temperature distribution. The black contours with levels of 3, 7, and 11 Myr sr−1 represent the Planck 850 μm continuum. The red contours represent the Hα emission (Finkbeiner 2003) in units of R (106∕4π photons cm−2 s−1 sr−1), with levels from 15 to 215 stepped by 40.
Current usage metrics show cumulative count of Article Views (full-text article views including HTML views, PDF and ePub downloads, according to the available data) and Abstracts Views on Vision4Press platform.
Data correspond to usage on the plateform after 2015. The current usage metrics is available 48-96 hours after online publication and is updated daily on week days.
Initial download of the metrics may take a while.