Fig. 17.
Download original image
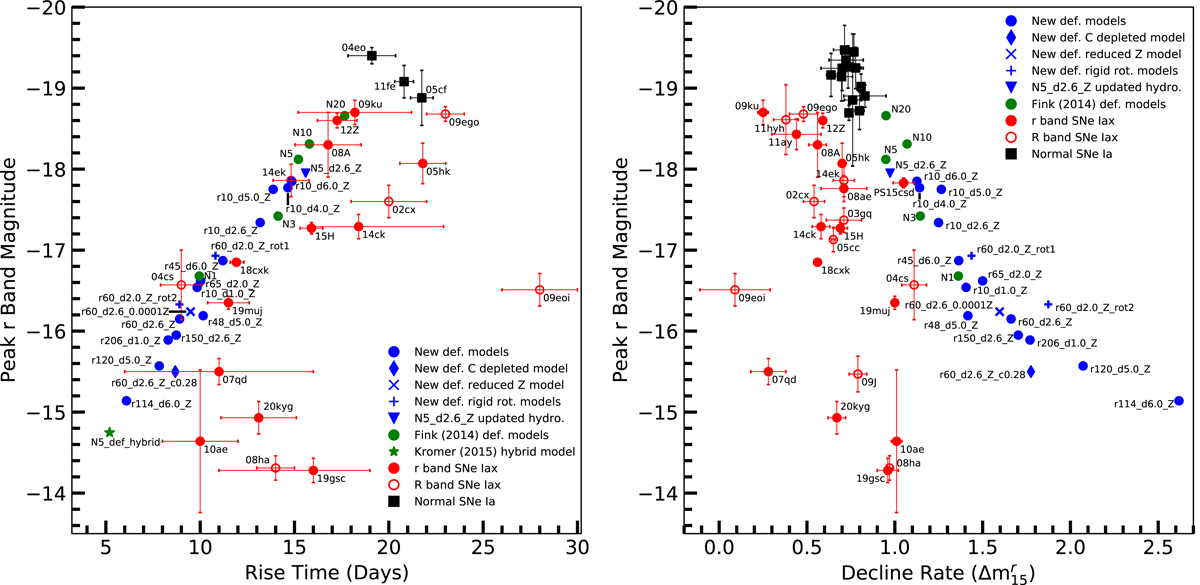
Peak r-band magnitudes vs. rise time (left) and peak r-band magnitudes vs. decline rate in terms of Δm15 (right) for the models of F14 (green), our new sequence of models (blue), real SNe Iax (red) and normal SNe Ia (black). The filled red circles represent measurements in the r-band while the unfilled red circles represent measurements in the R-band. The observations include those compiled by Magee et al. (2016) as well as SN 2014ck (Tomasella et al. 2016), SN 2014ek (Li et al. 2018), SN 2018cxk (Yao et al. 2019), SN 2019muj (Barna et al. 2021), SN 2019gsc (Tomasella et al. 2020; Srivastav et al. 2020) and SN 2020kyg (Srivastav et al., in prep.). The blue diamond, cross and plus markers correspond to models which are variations on the standard r60_d2.6_Z model. The blue diamond represents r60_d2.6_Z_c0.28 (carbon depleted model), the cross depicts r60_d2.6_0.0001Z (reduced Z model) and the blue plus signs represent r60_d2.0_Z_rot1 and r60_d2.0_Z_rot2 (rigidly rotating models). The blue triangle represents the N5_d2.6_Z model from the F14 deflagration study simulated again using the updated version of the LEAFS code to quantify the difference caused by using the newer version of the code. The green star represents the hybrid CONe WD model produced by K15.
Current usage metrics show cumulative count of Article Views (full-text article views including HTML views, PDF and ePub downloads, according to the available data) and Abstracts Views on Vision4Press platform.
Data correspond to usage on the plateform after 2015. The current usage metrics is available 48-96 hours after online publication and is updated daily on week days.
Initial download of the metrics may take a while.