Fig. 8
Download original image
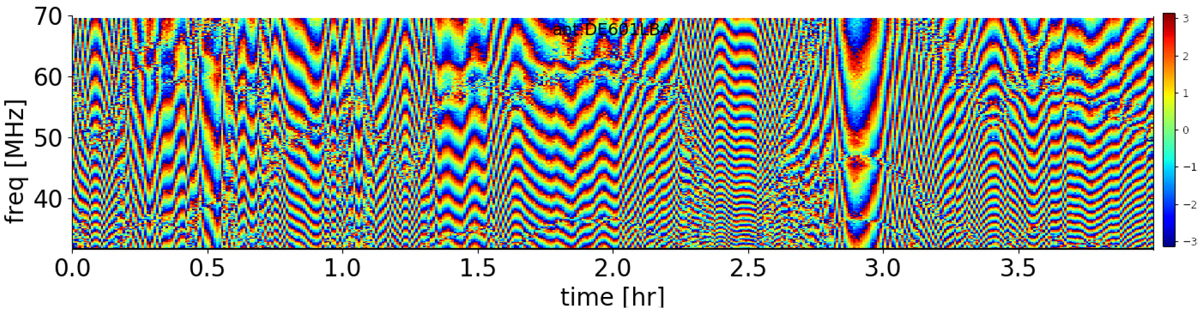
Overview of the XX phase corrections on station DE601LBA (Effelsberg, Germany), relative to the phased-up core, of a 4-h scan of 3C 380. The scan is divided into time and frequency bins (in this case, 32 s wide bins in time space and 195 kHz in frequency space). In each bin, DPPP computes a single value for the phase correction for each polarization and for each antenna. The x-axis labels the time and the y-axis labels the frequency (in MHz) for each bin. The colormap represents the correction in radians, ranging from − π to π. From this image, we can determine the dTEC value to be about ~0.5 × 10¹⁶ m−2, referenced to the phased-up core (see, e.g., van Weeren et al. 2016). In the frequency direction the correction wraps around many times, depending on the severity of ionospheric conditions. The width of the bins is chosen to be as broad as possible (to increase the signal-to-noise ratio in each bin), while still ensuring that the correction does not change appreciably.
Current usage metrics show cumulative count of Article Views (full-text article views including HTML views, PDF and ePub downloads, according to the available data) and Abstracts Views on Vision4Press platform.
Data correspond to usage on the plateform after 2015. The current usage metrics is available 48-96 hours after online publication and is updated daily on week days.
Initial download of the metrics may take a while.