Fig. 6
Download original image
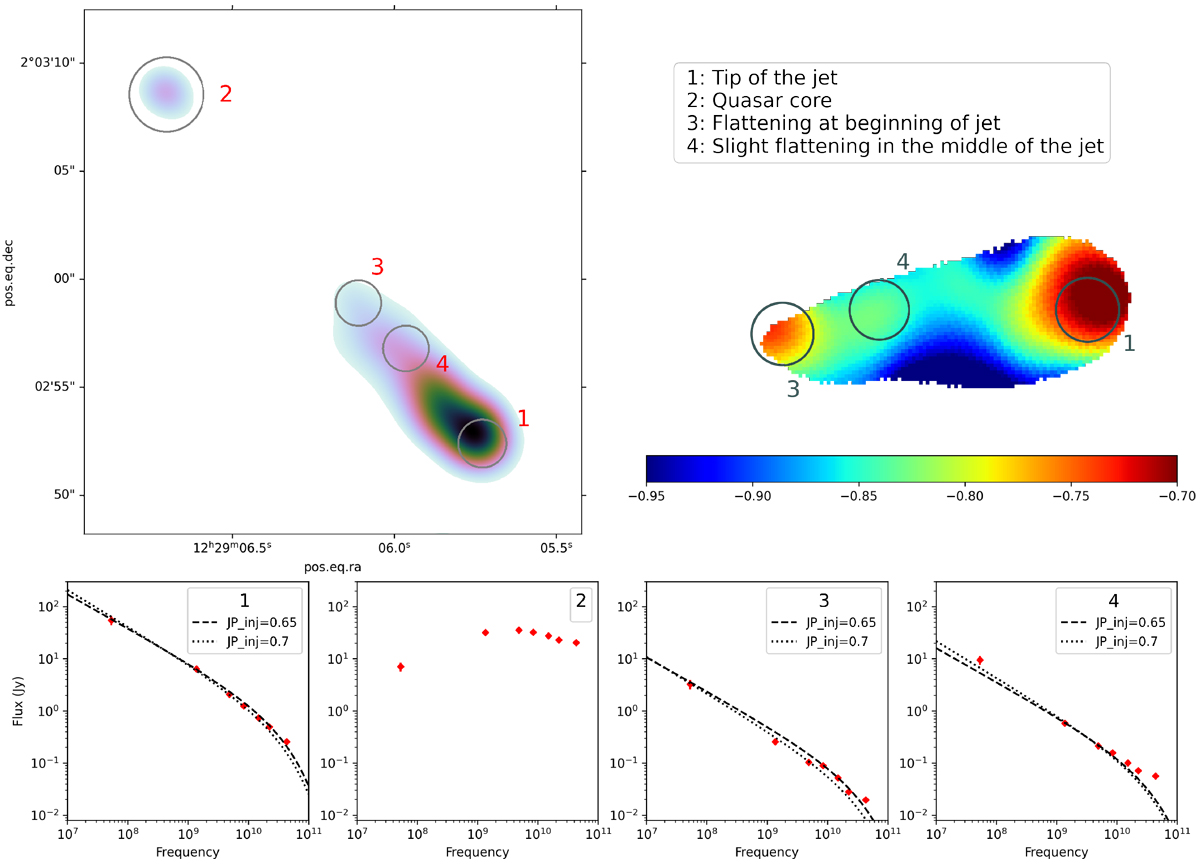
Spectra of four different locations of 3C 273 using data from Perley & Meisenheimer (2017). The locations are indicated by circles in the 30–80 MHz images in the top left panel and the spectral index map in the top right panel. Overplottedare JP spectra (Jaffe & Perola 1973), shifted to match the spectra. This means that it is not possible to extract an estimate of the age or magnetic field from this data alone. The VLA images and LOFAR LBA image are all smoothed to a similar circular beam before the flux densities in the indicated regions is determined. The flux densities tend to exceed the flux density given by the JP model.
Current usage metrics show cumulative count of Article Views (full-text article views including HTML views, PDF and ePub downloads, according to the available data) and Abstracts Views on Vision4Press platform.
Data correspond to usage on the plateform after 2015. The current usage metrics is available 48-96 hours after online publication and is updated daily on week days.
Initial download of the metrics may take a while.