Fig. 5
Download original image
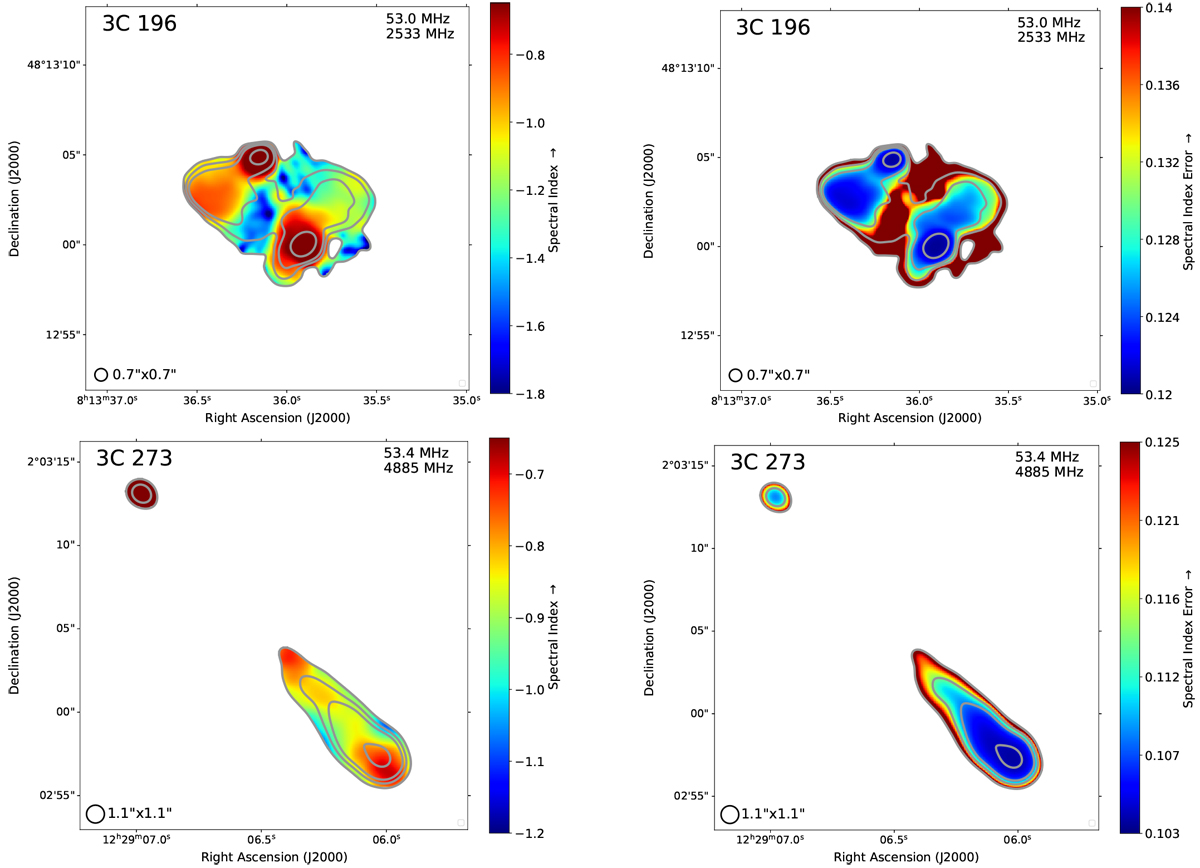
Spectral index maps and spectral index error maps of 3C 196 and 3C 273. Left: Spectral index maps of 3C 273 and 3C 196, between LBA and VLA C-band and VLA S-band, respectively. For each image the VLA and LBA images are convolved to a matching circular beam. Contours correspond to LOFAR LBA fluxes, at 20σ, 50σ, 100σ, and 500σ, with σ = 0.062 Jy for 3C 273 and σ = 0.011 Jy for 3C 196. These noise levels are different from the noise levels in Fig. 3, due to the beam being smoothed to a circular beam in order to match the VLA resolution. Data from Perley & Meisenheimer (2017) were used for 3C 273, and publicly available VLA data from project TCAL0001 for 3C 196, along with the LBA data presented in this paper. Right: Spectral index error maps of 3C 273 and 3C 196. The errors are made under the assumption that the LOFAR fluxes have a total error consisting of the RMS noise + 20% flux error. Similarly, this assumes that the VLA fluxes have a total errorconsisting of the RMS noise + 2.5% flux error. The error caused by the relative flux error on the VLA and LOFAR fluxes is independent of the position (i.e., irrelevant for comparing two regions of the same source). This error is equal to the minimum value of the color bar.
Current usage metrics show cumulative count of Article Views (full-text article views including HTML views, PDF and ePub downloads, according to the available data) and Abstracts Views on Vision4Press platform.
Data correspond to usage on the plateform after 2015. The current usage metrics is available 48-96 hours after online publication and is updated daily on week days.
Initial download of the metrics may take a while.