Fig. 3
Download original image
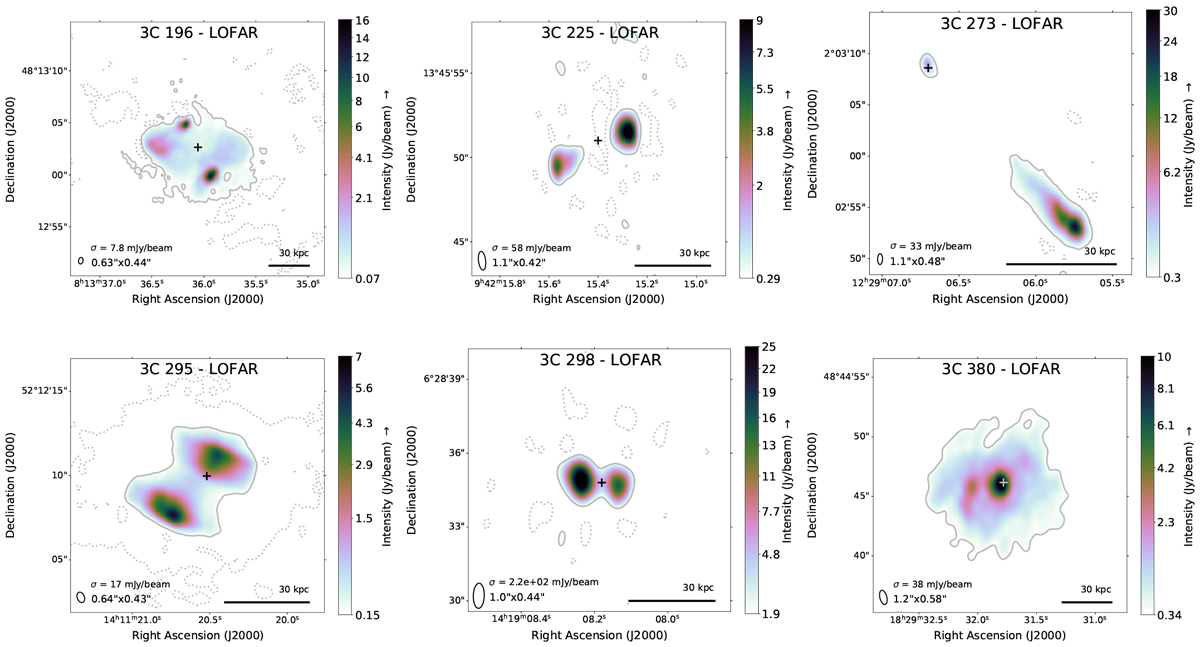
Images of the six 3C sources, observed in the range 30–80 MHz. The beam sizes are indicated in the bottom left corner. The optical counterparts of the sources are indicated with crosses. The positions of the optical counterparts were taken from Gaia EDR3 (Gaia Collaboration 2021) (3C 196, 3C 298, and 3C 273), Reyes et al. (2008) (3C 295), and Fanti et al. (2011) (3C 273). The brightness scale starts at the 9σ noise level (σrms), which is also indicated by the single solid contour. The dashed contours reveal spurious negative emission due to calibration artifacts at the − 3σrms level.
Current usage metrics show cumulative count of Article Views (full-text article views including HTML views, PDF and ePub downloads, according to the available data) and Abstracts Views on Vision4Press platform.
Data correspond to usage on the plateform after 2015. The current usage metrics is available 48-96 hours after online publication and is updated daily on week days.
Initial download of the metrics may take a while.