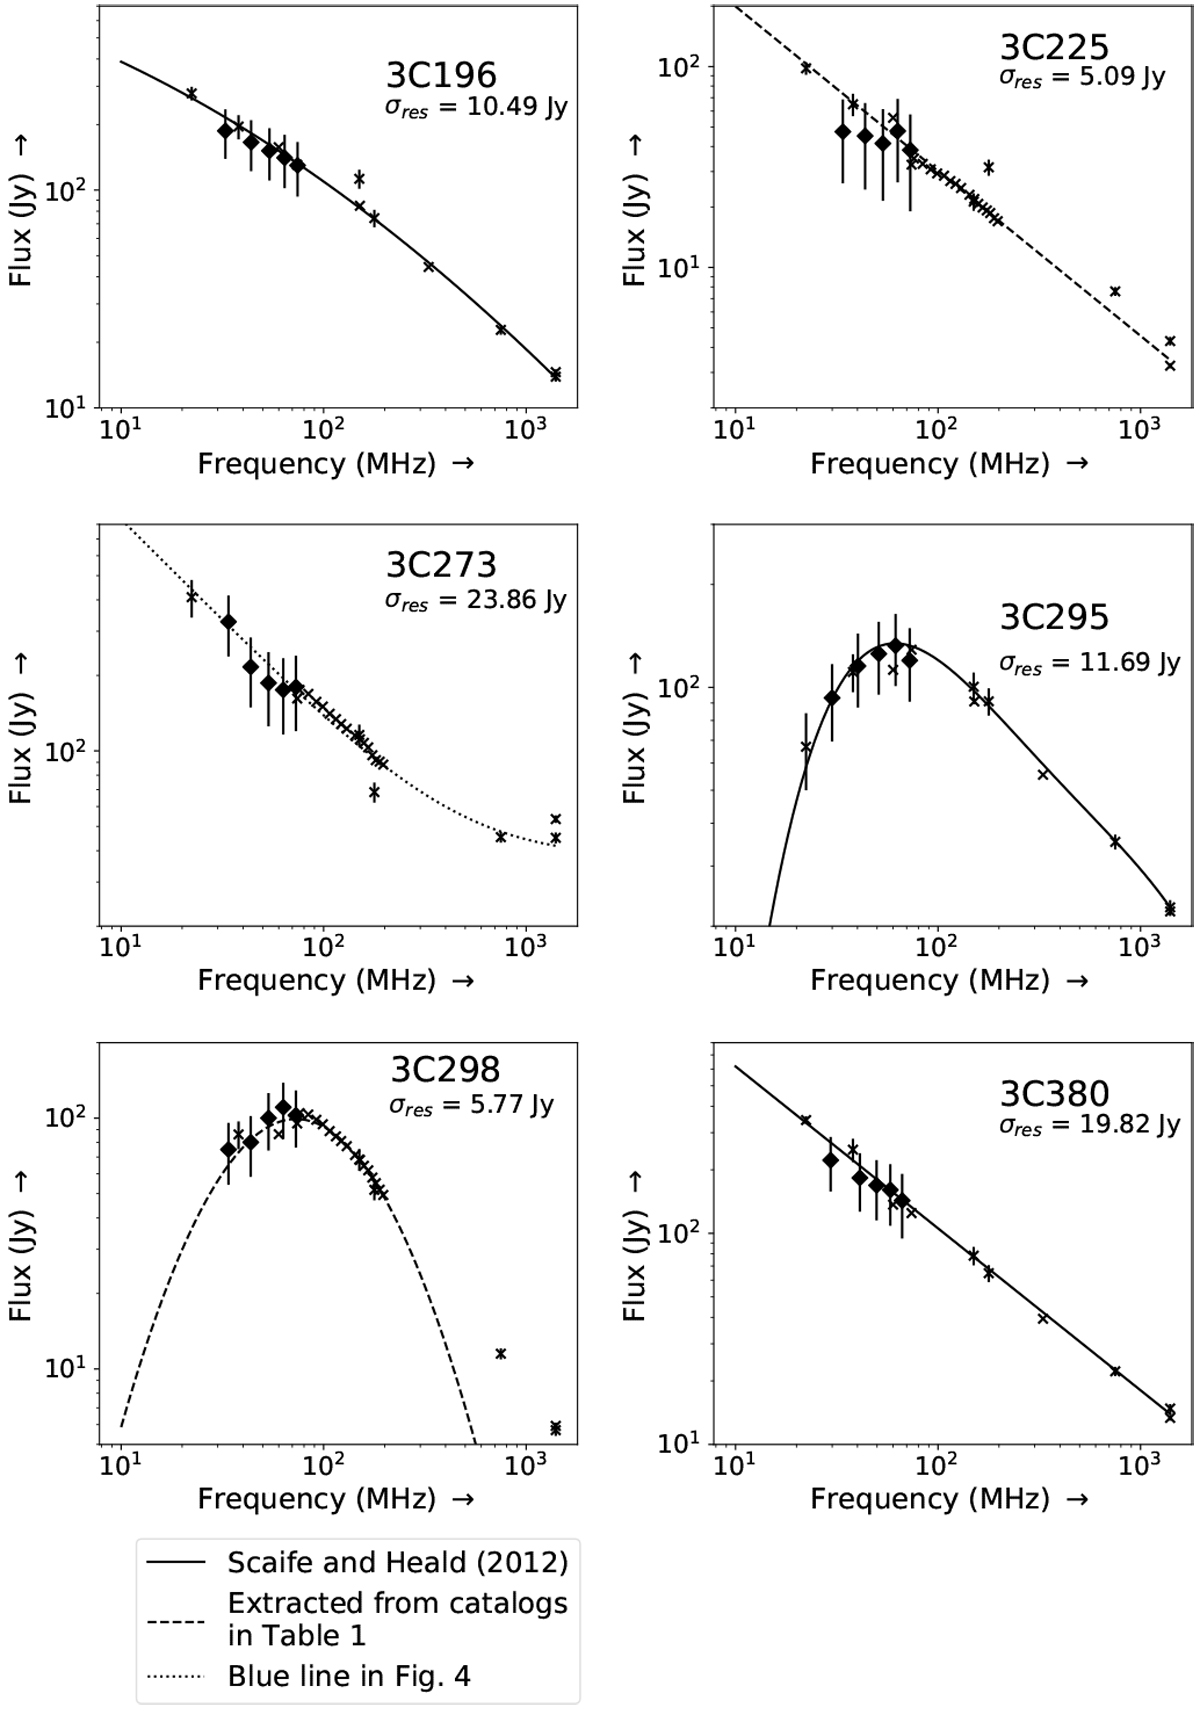
Fig. 1
Download original image
Low-frequency spectra for our targets. The low-frequency flux densities were measured using the Dutch LOFAR array (see also Table 2). The filled diamonds represent LOFAR flux densities, and the crosses represent data extracted from the catalogs listed in Table 3. For 3C 196, 3C 295, and 3C 380 the black solid line shows the flux scale model of Scaife & Heald (2012). For 3C 273 the fitting result of the blue line (total flux) of Fig. 7 is shown, with the functional form of Eq. (2). The differences between the flux densities and the fit (residuals) are approximated by a Gaussian distribution, and the standard deviations of these residuals are given for each target in the figure. The error bars on the LOFAR data consist of 20% of the flux density added to the standard deviation of the residuals. The uncertainties of the other data points were extracted from the literature.
Current usage metrics show cumulative count of Article Views (full-text article views including HTML views, PDF and ePub downloads, according to the available data) and Abstracts Views on Vision4Press platform.
Data correspond to usage on the plateform after 2015. The current usage metrics is available 48-96 hours after online publication and is updated daily on week days.
Initial download of the metrics may take a while.