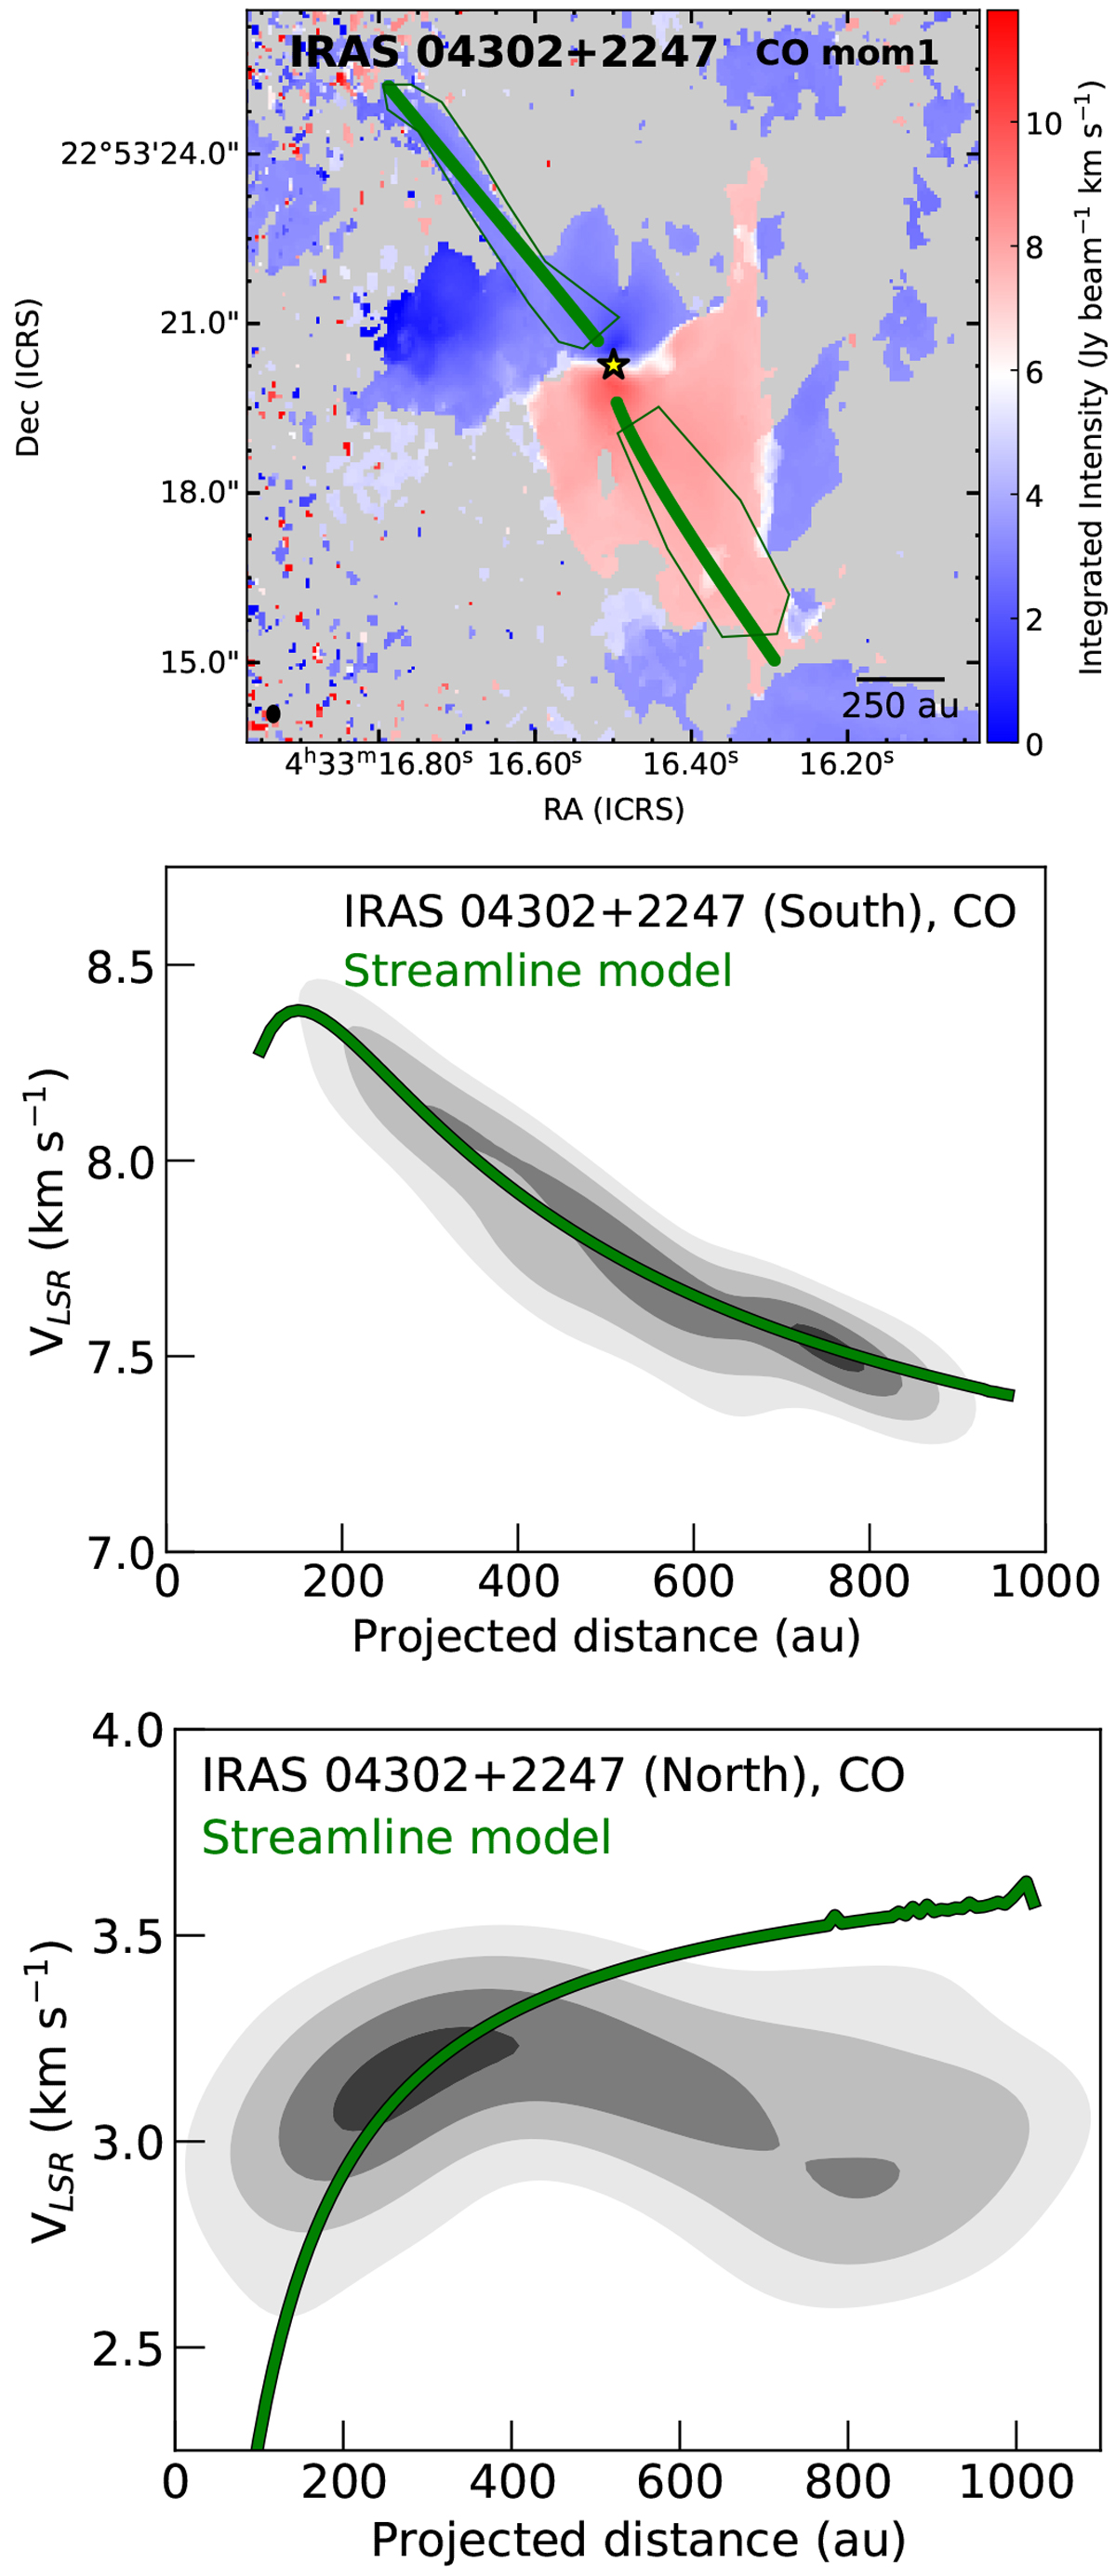
Fig. B.5
Download original image
Infalling streamline model for the two IRAS04302 streamers. Top: Streamline models, plotted in green, on top of the moment-1 map of CO, spatially matching the observed streamer emission to both the south and north (outlined in the green polygons). Middle and bottom: Velocity components of CO taken from inside the south and north green polygons, respectively,plotted as a function of projected distance from the central young stellar object, with varying levels of kernel density estimation of the velocity plotted as filled contours and contours calculated as in Fig. B.1. The streamline models are shown in green. For the southern streamer, the CO emission is entirely described by the streamline model. For the northern streamer, the streamline model corresponds well with the emission at radii less than 400 au, but the model over-predicts the velocity at larger radii, hinting at a more complex velocity field in this system.
Current usage metrics show cumulative count of Article Views (full-text article views including HTML views, PDF and ePub downloads, according to the available data) and Abstracts Views on Vision4Press platform.
Data correspond to usage on the plateform after 2015. The current usage metrics is available 48-96 hours after online publication and is updated daily on week days.
Initial download of the metrics may take a while.