Fig. B.4
Download original image
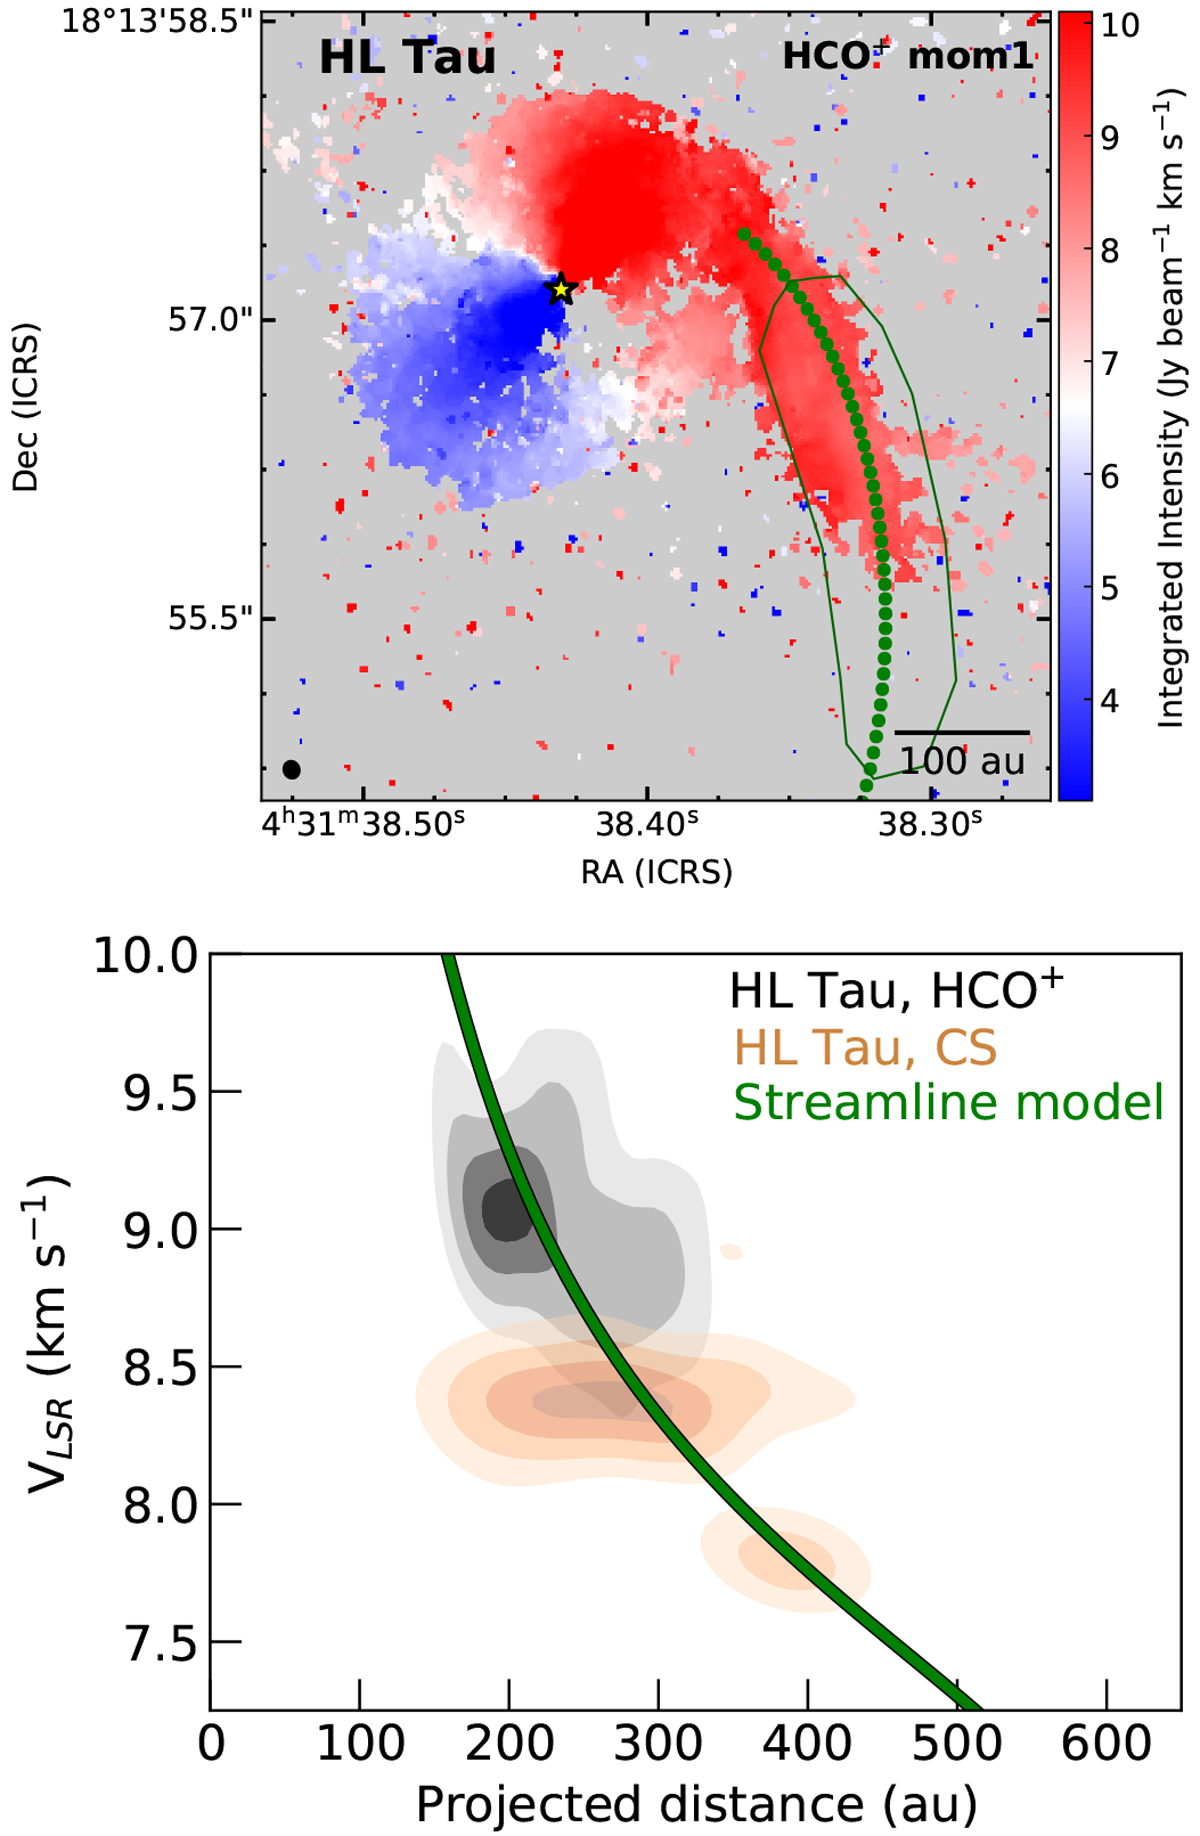
Infalling streamline model for the HL Tau streamer. Top: Streamline model, plotted in green, on top of the moment-1 map of HCO+, spatially matching the observed streamer emission extending to the south (outlined in the green polygon). The model predicts that the streamer should extend beyond the HCO+ emission, into a region traced by CS (see Fig. 3). Bottom: Velocity components of HCO+ (black) andCS (orange) taken from inside the green polygon plotted as a function of projected distance from the central young stellar object, with varying levels of kernel density estimation of the velocity plotted as filled contours and contours calculated as in Fig. B.1. The streamline model is shown in green, and highlights that both HCO+ and CS trace different parts of the same infalling streamer.
Current usage metrics show cumulative count of Article Views (full-text article views including HTML views, PDF and ePub downloads, according to the available data) and Abstracts Views on Vision4Press platform.
Data correspond to usage on the plateform after 2015. The current usage metrics is available 48-96 hours after online publication and is updated daily on week days.
Initial download of the metrics may take a while.