Fig. 6
Download original image
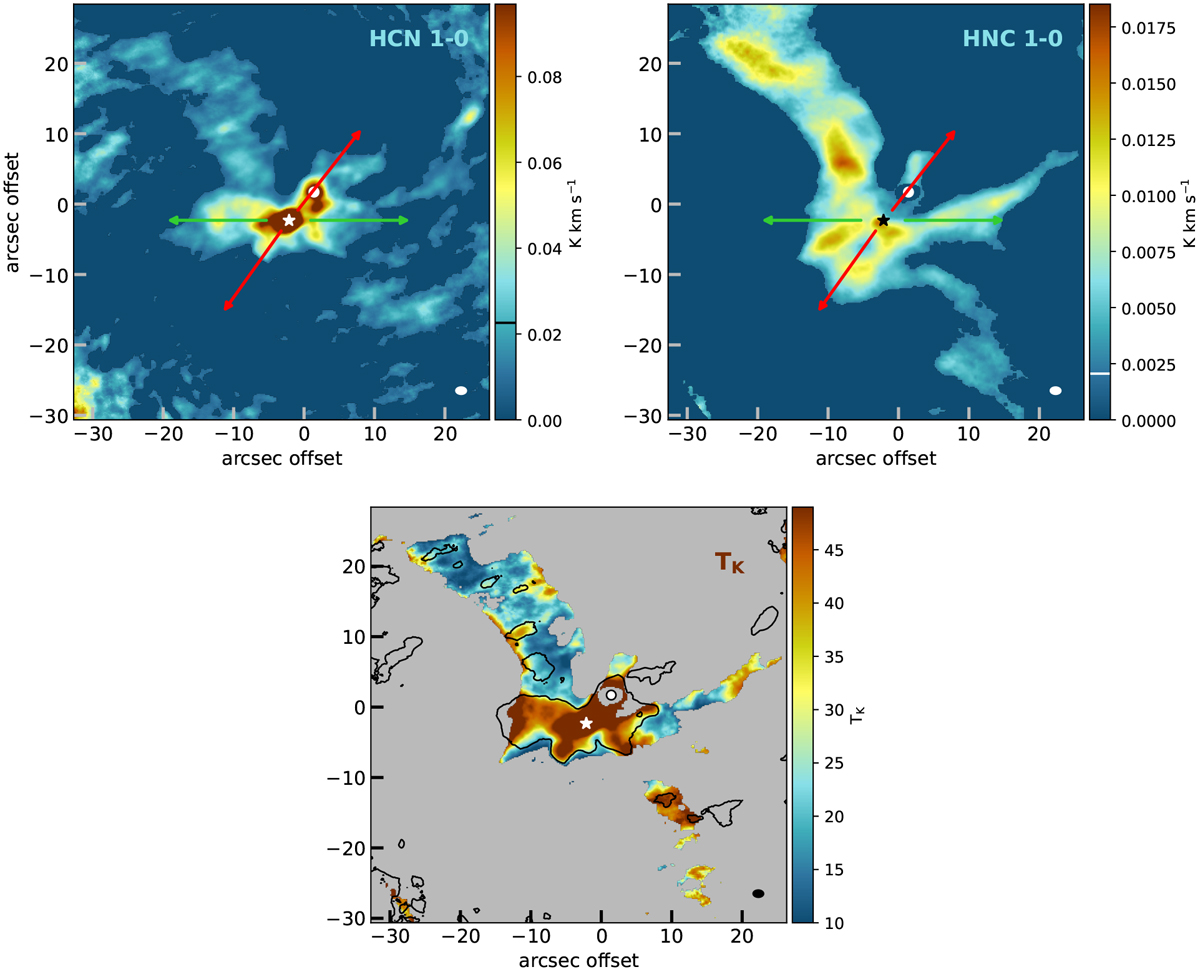
Intensity integrated map of HCN (top left) and HNC (top right) in K km s−1. The HCN map was masked at 1σ (0.07 Jy beam km s−1) and the HNC map at 3σ (0.02 Jy beam km s−1) before being converted to brightness temperature. The 3σ level is indicated on the colorbar with a horizontal black or white line. Source A and B positions are marked with a star and circle, respectively. The arrows indicate the E–W (green) and NW–SE (red) outflow directions from source A. The white ellipse in the bottom-left corner indicates the map beam size. The gas kinetic temperature (TK) map, obtained from HCN/HNC and Eqs. (1) and (2), is shown in the bottom panel. The color scale is limited by the HNC 3σ level. The black contours indicate the HCN 3σ level, outside of which TK is an upperlimit. The lack of HCN emission indicates that the N–S ridge is mainly composed of cold gas, which is constrained by the ratio upper limits. Temperatures above 40 K are not well constrained by the HCN/HNC ratio, and hence the temperature scale only runs up to 49 K.
Current usage metrics show cumulative count of Article Views (full-text article views including HTML views, PDF and ePub downloads, according to the available data) and Abstracts Views on Vision4Press platform.
Data correspond to usage on the plateform after 2015. The current usage metrics is available 48-96 hours after online publication and is updated daily on week days.
Initial download of the metrics may take a while.