Fig. 4
Download original image
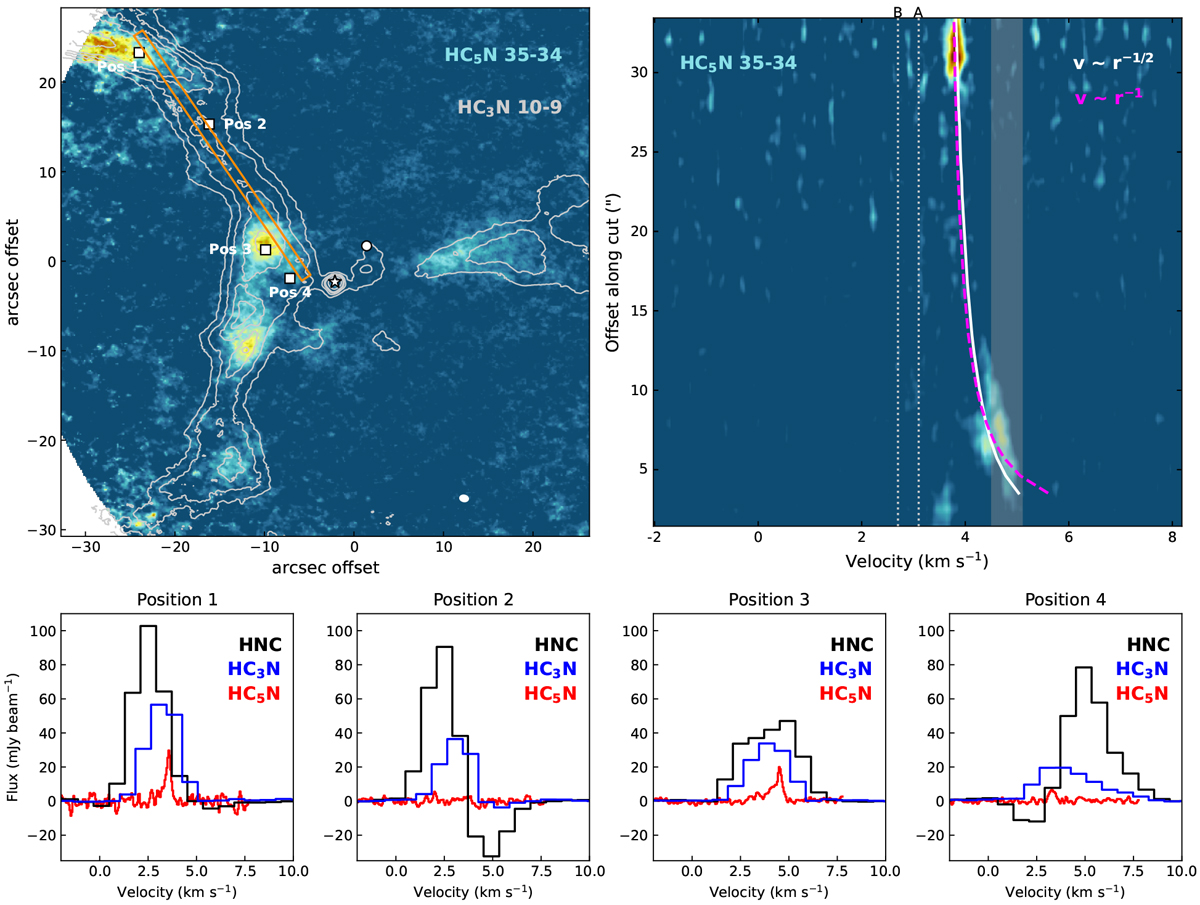
Kinematic analysis of the N–S ridge. Top-left panel: integrated intensity map of HC5N (color scale) overlaid with HC3N contours, as in Fig. 3. The white star and circle mark sources A and B, respectively. The white ellipse in the bottom-right corner shows the beam size. Top-right panel: Cut used to make the PV diagram with source A located at offset 0 (indicated by the orange rectangle in the top-left panel). The vertical dotted lines mark the systemic velocity of A and B. The white and magenta lines show free-fall and infall curves, respectively. The velocity range with E–W-outflow-related emission is shown as the shaded area (4.5 and 5.1 km s−1) (Fig. B.1). Bottom row: HNC, HC3N, and HC5N spectra extracted from the corresponding positions marked in the top-left panel. The changes in peak velocity and line shape are signatures of moving gas. HNC and HC3N show an inverse P Cygni profile along the middle of the N–S ridge (Position 2, ~20′′ from source A), indicating infall. Near source A (Position 4, ~5′′) HNC shifts to a P Cygni profile, consistent with the presence of outflow in this region.
Current usage metrics show cumulative count of Article Views (full-text article views including HTML views, PDF and ePub downloads, according to the available data) and Abstracts Views on Vision4Press platform.
Data correspond to usage on the plateform after 2015. The current usage metrics is available 48-96 hours after online publication and is updated daily on week days.
Initial download of the metrics may take a while.