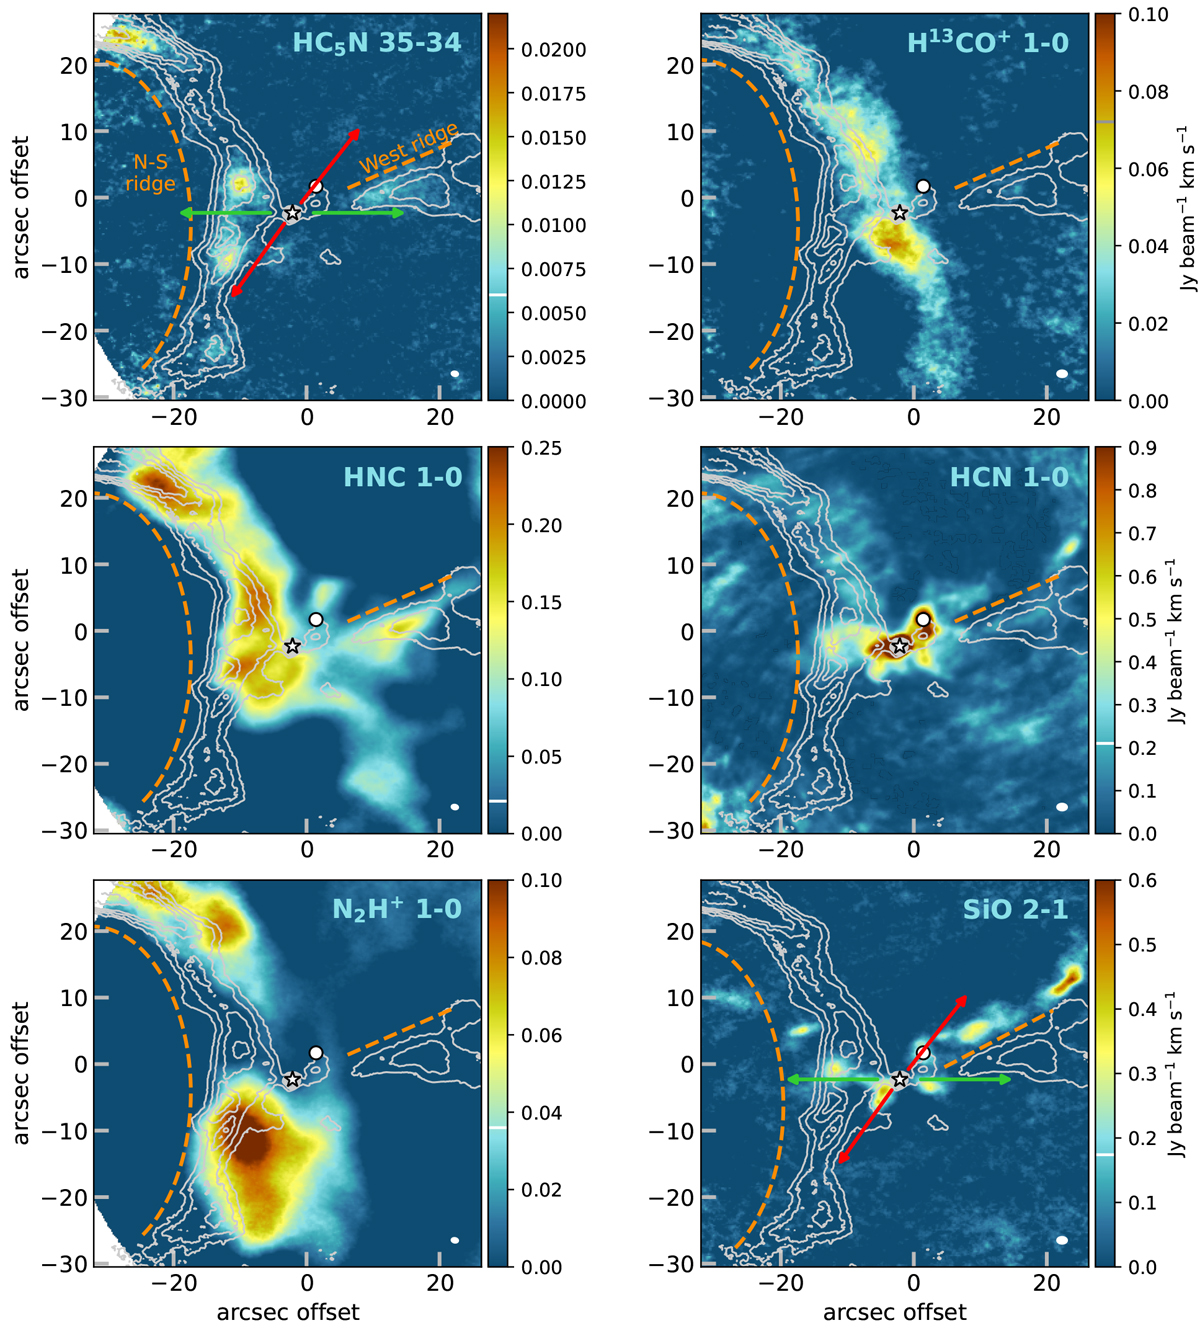
Fig. 3
Download original image
ALMA Band 3 intensity integrated maps of the molecular species that show extended emission around IRAS 16293−2422. The 3σ level is indicated on the colorbar with a horizontal white or gray line. HC3N 10–9 is overlaid in contours with steps of 3, 5, 7, 9, and 15σ, with σ = 10 mJy beam−1 km s−1. The positions of IRAS 16293 A and B are marked with a star and circle, respectively. The dashed orange lines indicate the structures identified in this work. The arrows indicate the E–W (green) and NW-SE (red) outflow directions from source A. The white ellipses in the bottom-right corner indicate the beam of the observations.
Current usage metrics show cumulative count of Article Views (full-text article views including HTML views, PDF and ePub downloads, according to the available data) and Abstracts Views on Vision4Press platform.
Data correspond to usage on the plateform after 2015. The current usage metrics is available 48-96 hours after online publication and is updated daily on week days.
Initial download of the metrics may take a while.