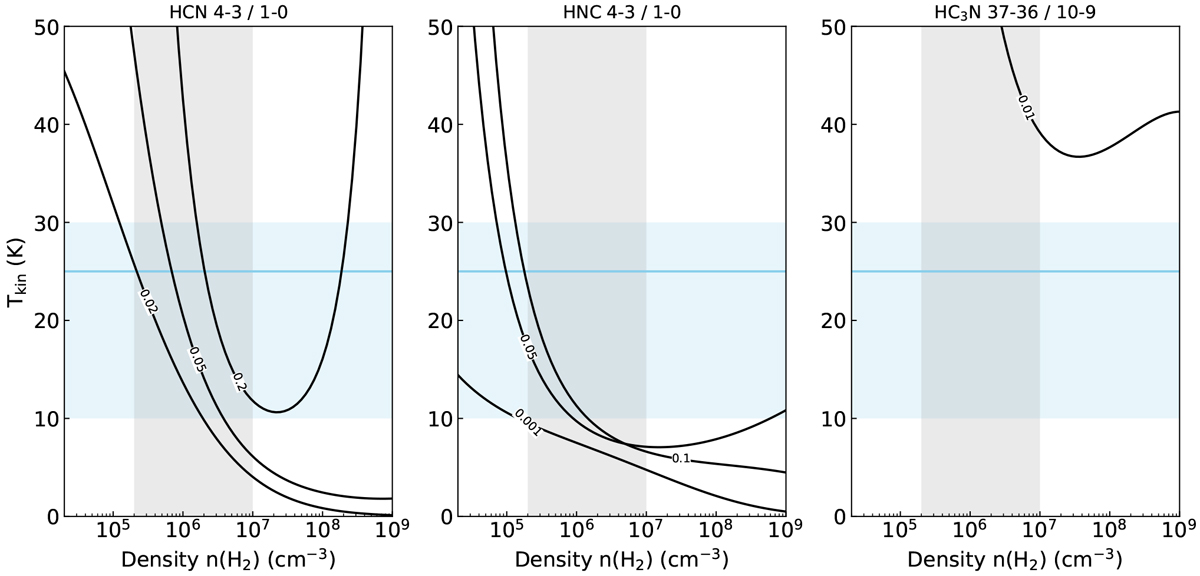
Fig. C.1
Download original image
Calculated brightness temperature ratios for HCN 4–3/1–0 (left), HNC 4–3/1–0 (center), and HC3N 37–36/10–9 (right). Contours show modeled ratios assuming a column density of 1013 cm−2 and a line width of 2 km s−1 for all three molecular species. The light blue shaded region shows the temperature range derived from the HCN/HNC ratio, with the blue line indicating the mean gas temperature. The gray shaded area shows the density range for the N-S ridge derived from envelope models.
Current usage metrics show cumulative count of Article Views (full-text article views including HTML views, PDF and ePub downloads, according to the available data) and Abstracts Views on Vision4Press platform.
Data correspond to usage on the plateform after 2015. The current usage metrics is available 48-96 hours after online publication and is updated daily on week days.
Initial download of the metrics may take a while.