Fig. 1
Download original image
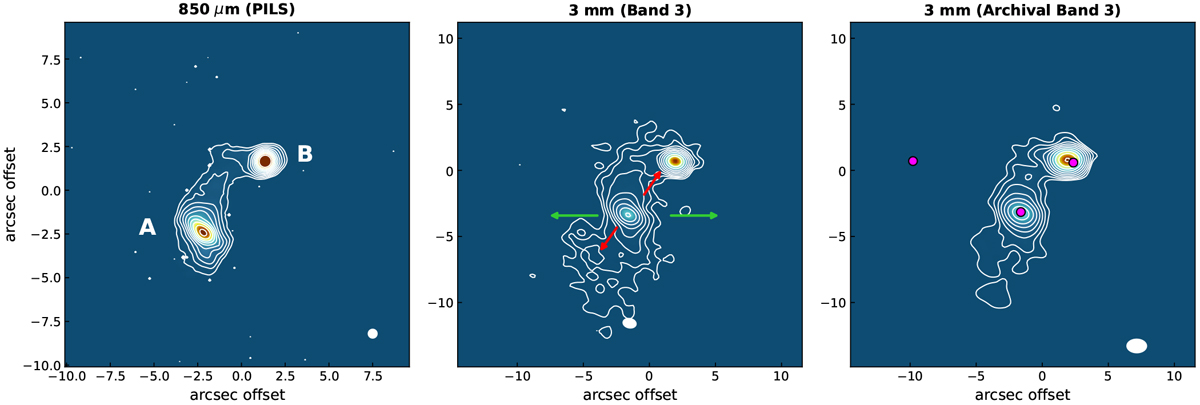
IRAS 16293−2422 observed with ALMA.The panels show dust continuum observations at 870 μm (PILS; left) and at 3 mm (center and right). The levels are spaced logarithmically from 30 to 900 mJy beam−1 for 870 μm, 0.6–170 mJy beam−1 for 3 mm, and 2.7–190 mJy beam−1 for the archival 3 mm continuum. The ellipse in the bottom-right corner shows the synthesized beam. The arrows indicate the E–W (green) and NW–SE (red) outflow directions from source A. The magenta-filled circles in the right panel indicate the positions from where the spectra shown in Fig. A.1 are extracted. The dust continuum emission at both wavelengths shows the bridge of material between the two sources. At 3 mm, the dust continuum extends southeast of source A, likely tracing part of the outflow cavity.
Current usage metrics show cumulative count of Article Views (full-text article views including HTML views, PDF and ePub downloads, according to the available data) and Abstracts Views on Vision4Press platform.
Data correspond to usage on the plateform after 2015. The current usage metrics is available 48-96 hours after online publication and is updated daily on week days.
Initial download of the metrics may take a while.