Fig. 3
Download original image
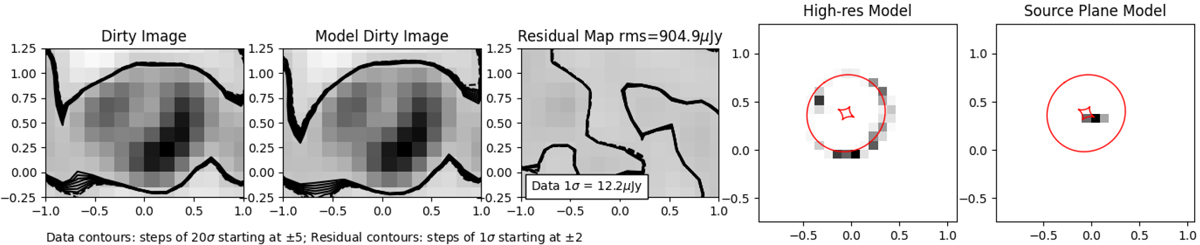
One of the results of the various MCMC runs to fit a source to a lens model for MG 0751+2716. The lens model, Model 1 (shown in Table 1), from Spingola et al. (2018) was used to fit our data using the VISILENS package. The images from left to right correspond to the dirty image of the lensed source, the dirty image of the lensed source obtained by fitting the lens model, the corresponding residual map, a high-resolution model, and the source plane model.
Current usage metrics show cumulative count of Article Views (full-text article views including HTML views, PDF and ePub downloads, according to the available data) and Abstracts Views on Vision4Press platform.
Data correspond to usage on the plateform after 2015. The current usage metrics is available 48-96 hours after online publication and is updated daily on week days.
Initial download of the metrics may take a while.