Fig. 9
Download original image
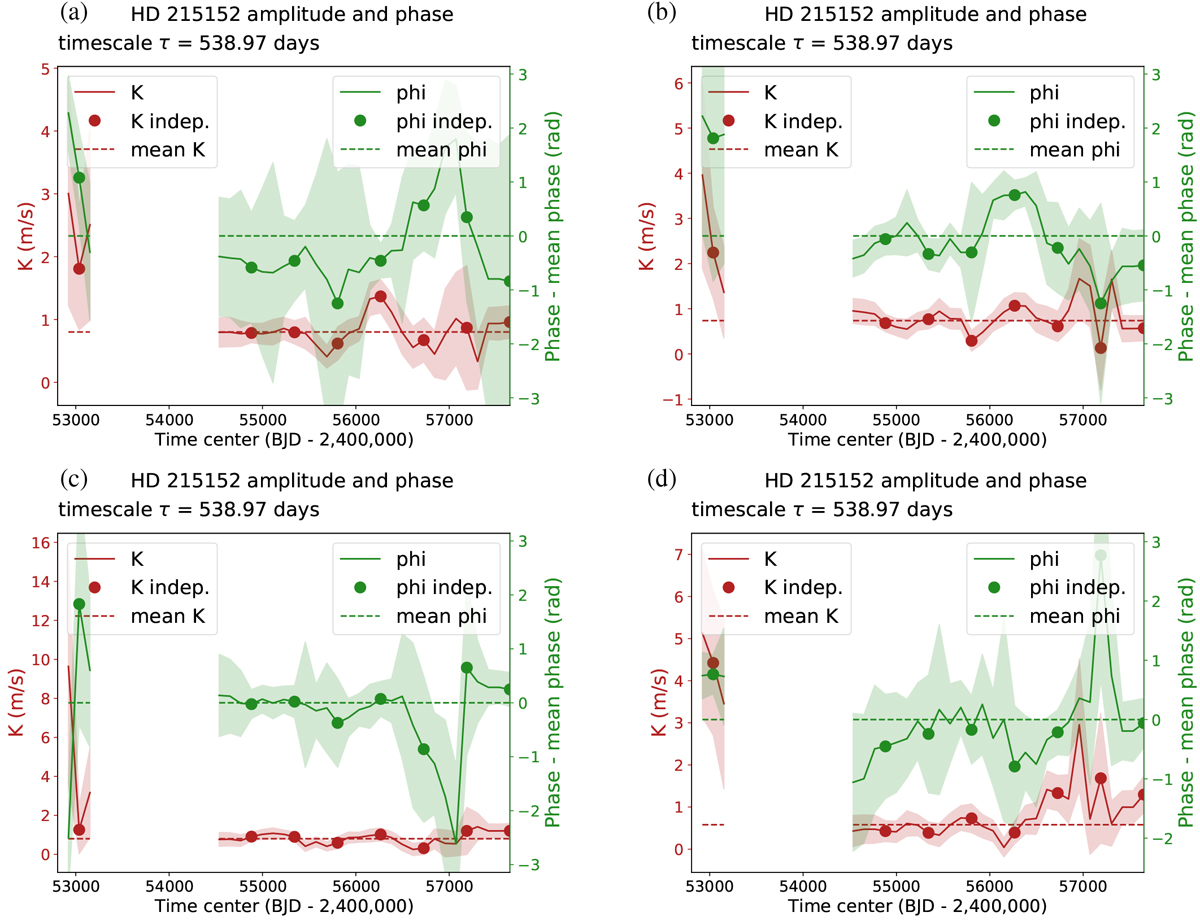
Phase and amplitude as a function of the time centre of the window t0, as described in Sect. 2.2 (solid red and green lines, respectively). Markers correspond to statistically independent estimates. Dashed red and green lines represent the average phase and amplitudes. The figures are all computed for a timescale of τ = 539 days, corresponding to τ∕Tobs = 1∕9. Plots (a), (b), (c), and (d) correspond to base models that include offsets, linear activity indicators, and all the claimed planets except the 5, 7, 10, and 25 day planets, respectively.
Current usage metrics show cumulative count of Article Views (full-text article views including HTML views, PDF and ePub downloads, according to the available data) and Abstracts Views on Vision4Press platform.
Data correspond to usage on the plateform after 2015. The current usage metrics is available 48-96 hours after online publication and is updated daily on week days.
Initial download of the metrics may take a while.