Fig. 11
Download original image
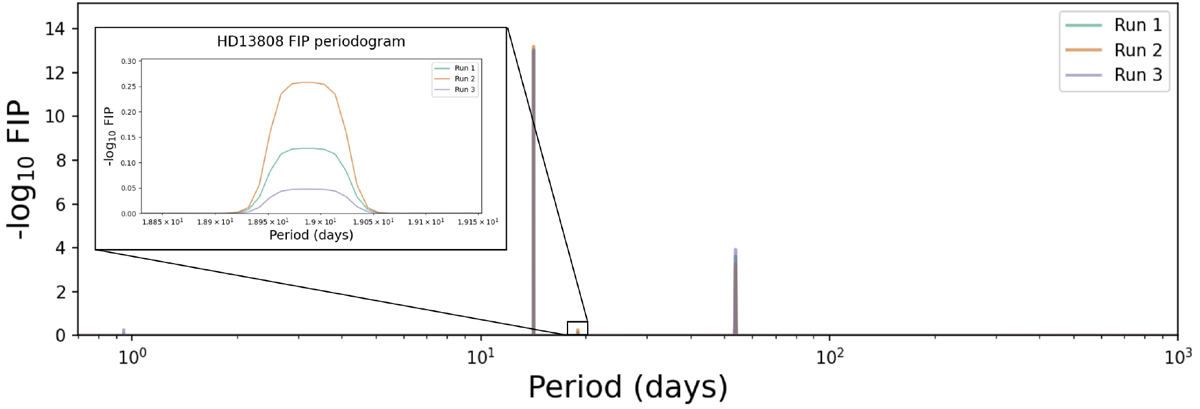
FIP periodogram of HD 13808: − log10 FIP (in blue) and log10 TIP (in yellow) of the presence of a planet in a centred frequency interval [ω − Δω, ω + Δω] as a functionof ω. Here, Δω = 2π∕Tobs, where Tobs is the total observation time span. Different colours correspond to independent computations with POLYCHORD. The plot inside the black box represents a zoom-in on the region close to 18.9 days.
Current usage metrics show cumulative count of Article Views (full-text article views including HTML views, PDF and ePub downloads, according to the available data) and Abstracts Views on Vision4Press platform.
Data correspond to usage on the plateform after 2015. The current usage metrics is available 48-96 hours after online publication and is updated daily on week days.
Initial download of the metrics may take a while.