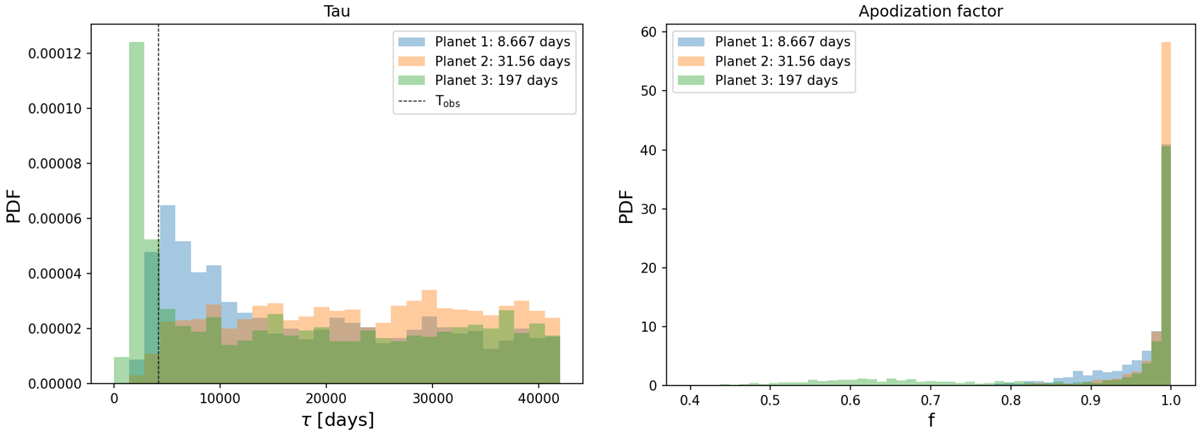
Fig. 10
Download original image
Diagnostics of the consistency of prensence of signals in the HD 69830 HARPS dataset. Left and right: posterior distribution of τ (defined in Eq. (16)) and f (defined in Eq. (8)) conditioned on the period P being such that |1∕P − 1∕Pi| = 1∕Tobs for i = 1, 2, 3 and P1 = 8.66 days, P2 = 31.56 days, and P3 = 197 days. The i = 1, 2, 3 correspondrespectively to the blue, orange, and green histograms. The black dotted line corresponds to τ = Tobs.
Current usage metrics show cumulative count of Article Views (full-text article views including HTML views, PDF and ePub downloads, according to the available data) and Abstracts Views on Vision4Press platform.
Data correspond to usage on the plateform after 2015. The current usage metrics is available 48-96 hours after online publication and is updated daily on week days.
Initial download of the metrics may take a while.