Fig. 6.
Download original image
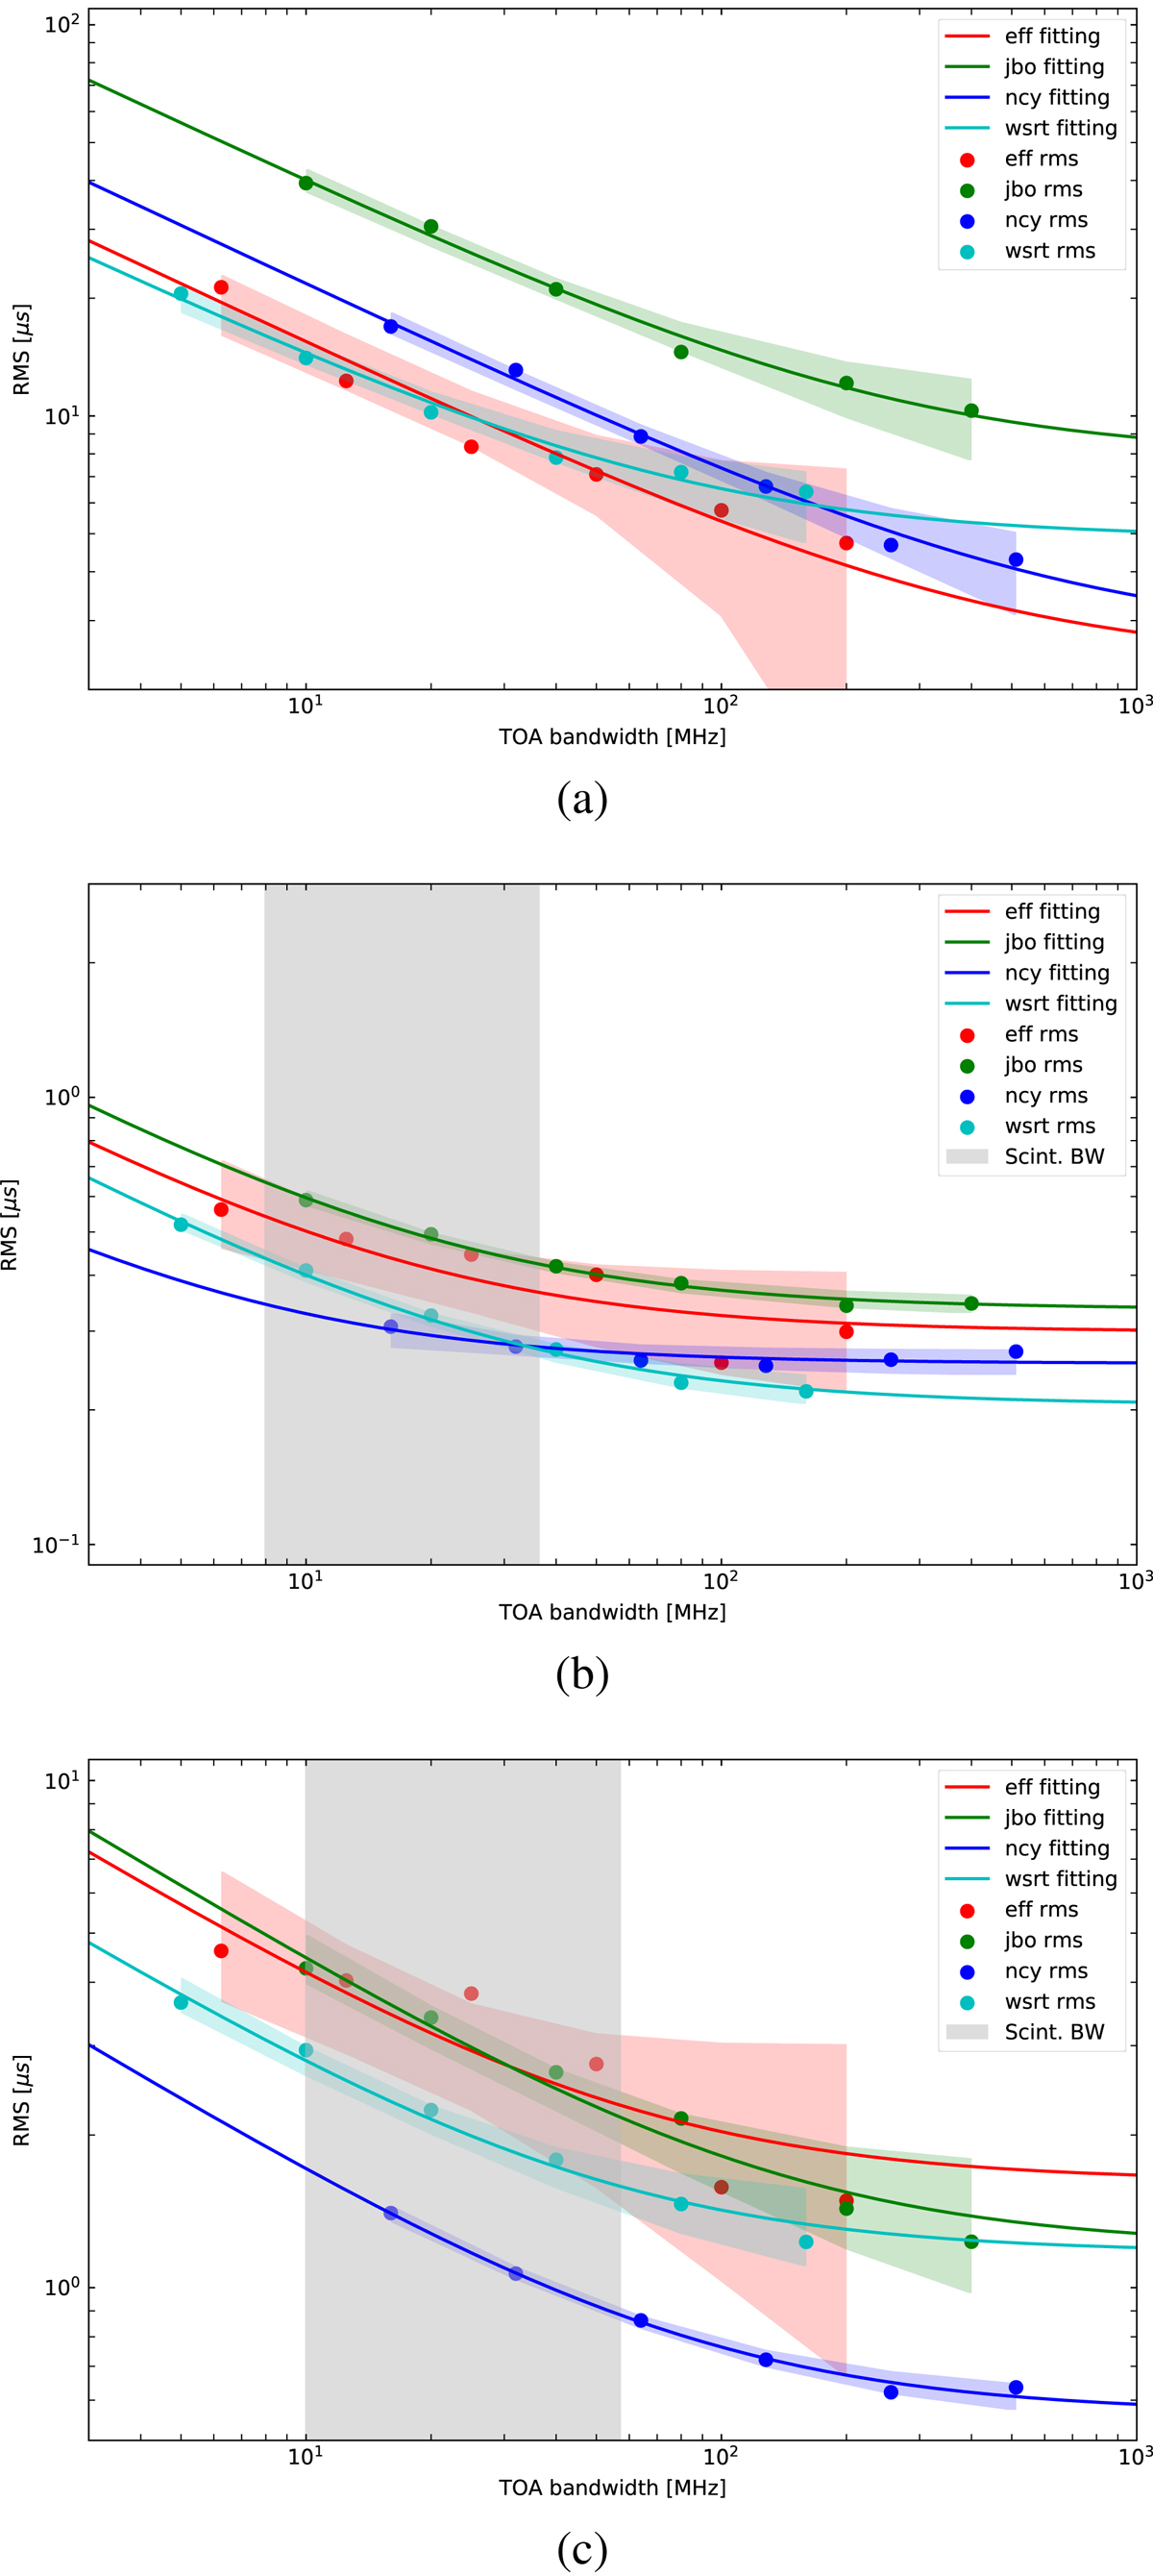
SLNF estimates for the three pulsars when the added template with the FDM CCA is used to generate the TOA with the available bandwidth at each telescope divided into the respective number of channels. The shaded regions along the fitted curves are the interquartile ranges for the fit, representing the error bounds on the estimated SLNF. The grey vertical bands show the expected scintillation bandwidth, estimated from the same data set as we present here (Liu et al. 2021). (a) SLNF estimates for PSR J0218+4232. (b) SLNF estimates for PSR J1713+0747. (c) SLNF estimates for PSR J2145−0750.
Current usage metrics show cumulative count of Article Views (full-text article views including HTML views, PDF and ePub downloads, according to the available data) and Abstracts Views on Vision4Press platform.
Data correspond to usage on the plateform after 2015. The current usage metrics is available 48-96 hours after online publication and is updated daily on week days.
Initial download of the metrics may take a while.