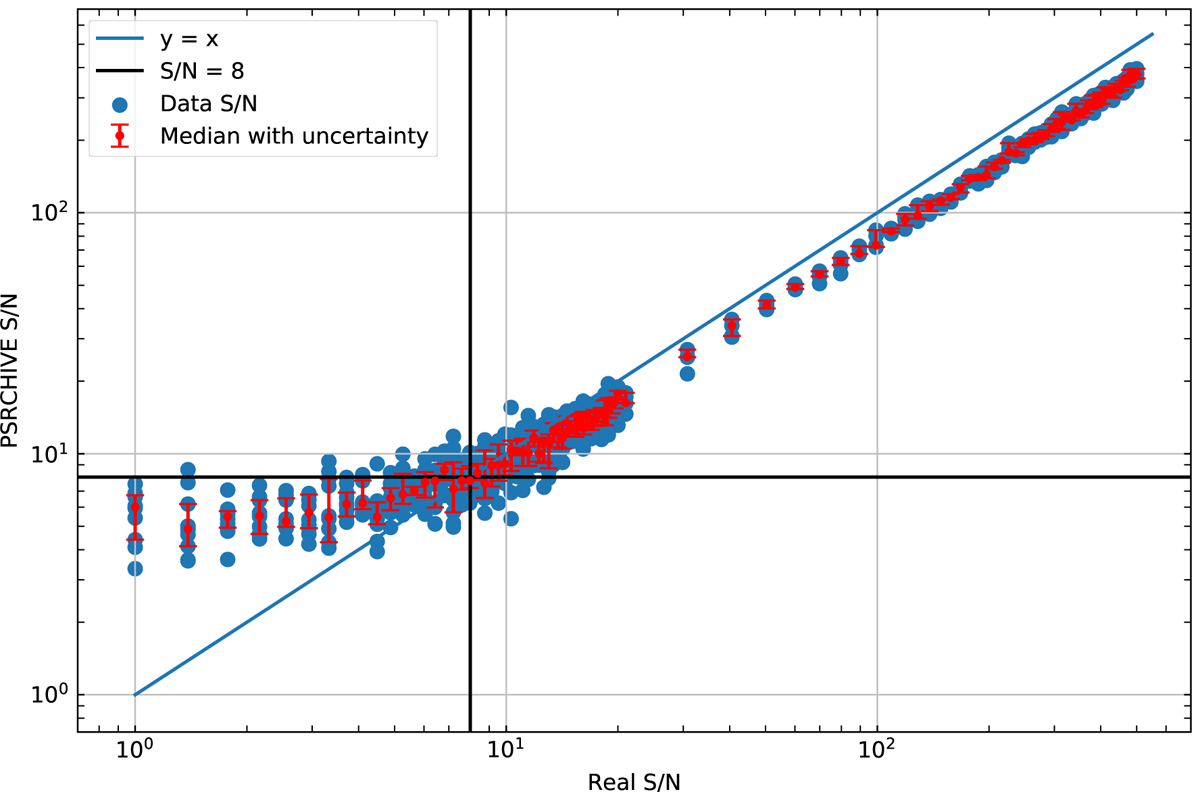
Fig. 4.
Download original image
S/N determined with the standard implementation in PSRCHIVE as a function of simulated S/N. The blue points are the S/N of the individual simulations, and the red points indicate the median value of the simulations. The red error bars indicate the 25th and 75th percentiles at each real S/N. For this simulation, the analytic template based on NRT data of PSR J2145−0750 was used. Due to differences in the definition of the S/N, some inconsistencies between x and y values are expected, although the scaling should be linear, as is the case in the high-S/N regime. In the low S/N regime (S/N < 10), the S/Ns returned by PSRCHIVE are typically overestimated and have a significant random component. (The thick black lines indicate S/Ns of 8, which is used as an S/N cut-off value in this work, following Arzoumanian et al. 2015).
Current usage metrics show cumulative count of Article Views (full-text article views including HTML views, PDF and ePub downloads, according to the available data) and Abstracts Views on Vision4Press platform.
Data correspond to usage on the plateform after 2015. The current usage metrics is available 48-96 hours after online publication and is updated daily on week days.
Initial download of the metrics may take a while.