Fig. 3.
Download original image
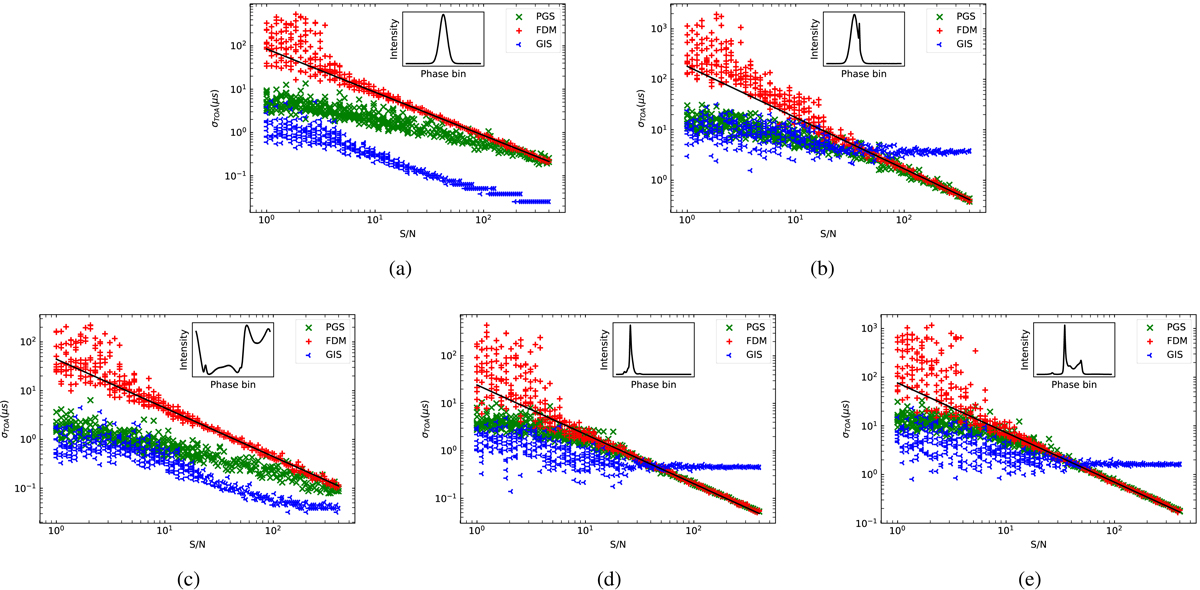
TOA uncertainty obtained from various noise-added profiles as a function of the simulated S/N. Top left panel: results for a simple Gaussian profile. Top right panel: results for a Gaussian profile with a notch. Bottom panels: results for the analytic templates of PSRs J0218+4232, J1713+0747, and J2145−0750, respectively, as derived from NRT data. CCAs are shown with different colours and markers, as indicated in the legend. The solid black line in each panel is a fit to high-S/N (> 10) FDM data and is extended to low-S/N data. At each S/N we plot, ten simulations were run, although they are typically indistinguishable at high S/N. The inset within each panel shows the profile. (a) Simple Gaussian profile. (b) Gaussian profile with a narrow notch. (c) PSR J0218+4232. (d) PSR J1713+0747. (e) PSR J2145−0750.
Current usage metrics show cumulative count of Article Views (full-text article views including HTML views, PDF and ePub downloads, according to the available data) and Abstracts Views on Vision4Press platform.
Data correspond to usage on the plateform after 2015. The current usage metrics is available 48-96 hours after online publication and is updated daily on week days.
Initial download of the metrics may take a while.