Fig. 2.
Download original image
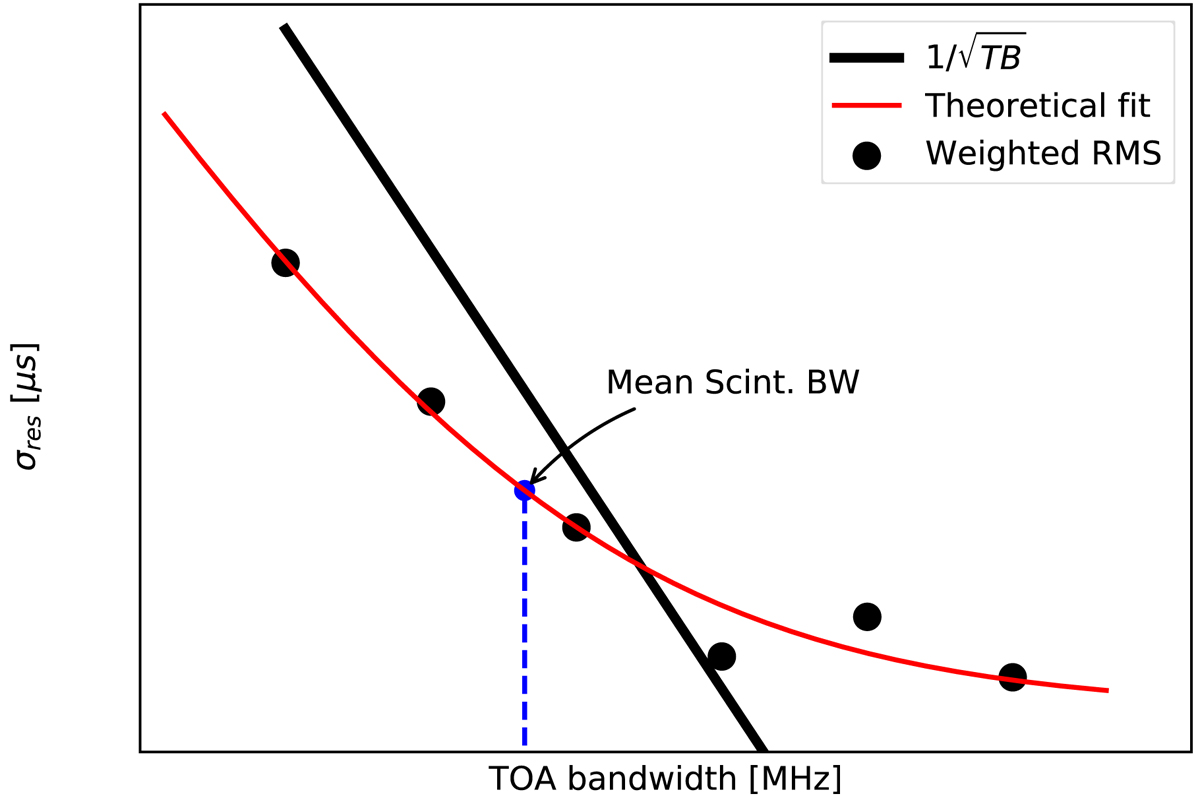
A sketch of the dependence of σres on TOA bandwidth, for an idealised dataset. The black dots represent rms values, the blue dashed line indicates the median scintillation bandwidth and the red line is a fit of Eq. (2). The black line is for the case of pure radiometer noise, i.e. with no jitter or other corrupting noise sources (σNF = 0) and for standard scaling following the radiometer equation (α = −1).
Current usage metrics show cumulative count of Article Views (full-text article views including HTML views, PDF and ePub downloads, according to the available data) and Abstracts Views on Vision4Press platform.
Data correspond to usage on the plateform after 2015. The current usage metrics is available 48-96 hours after online publication and is updated daily on week days.
Initial download of the metrics may take a while.