Fig. 5
Download original image
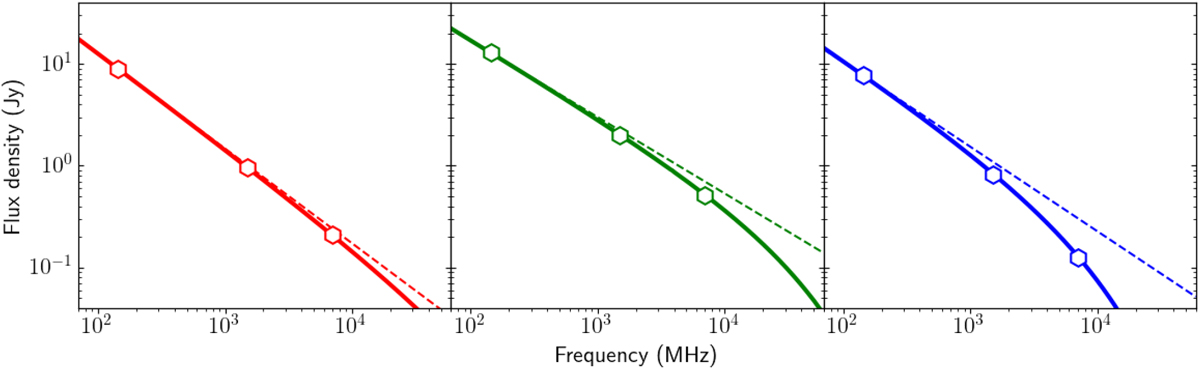
Illustration of the spectral curvature of the rings in the western lobe, assuming a Jaffe-Perola model (Jaffe & Perola 1973). From left to right: inner, middle, and outer rings with injection indices of αinj = −0.93, αinj = −0.75, and αinj= −0.83, respectively.The hexagons indicate the total flux densities of the rings at the three different frequencies. The error bars on these measurements are drawn, but do not extend beyond the marker. The solid lines show the spectra of the three rings with the amount of curvature as measured from the flux density measurements without background subtraction. The dashed lines show the respective injection spectra without any curvature for comparison.
Current usage metrics show cumulative count of Article Views (full-text article views including HTML views, PDF and ePub downloads, according to the available data) and Abstracts Views on Vision4Press platform.
Data correspond to usage on the plateform after 2015. The current usage metrics is available 48-96 hours after online publication and is updated daily on week days.
Initial download of the metrics may take a while.