Fig. 3
Download original image
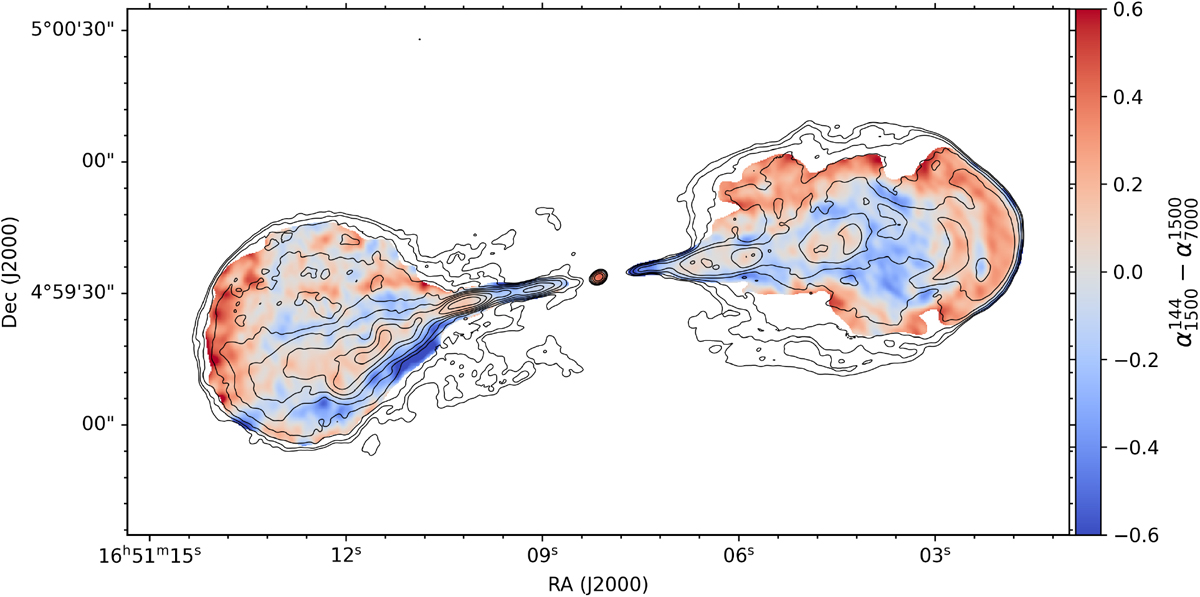
Spectral index curvature map of Hercules A. The spectral index curvature is calculated as the spectral index between 144 MHz and 1.5 GHz minus the spectral index between 1.5 and 7 GHz. The red regions indicate where the spectrum is steeper at high frequencies than at low frequencies, whereas the blue regions indicate where the spectrum is flatter at high frequencies than at low frequencies. The contours indicate the L-band emission (1.5 GHz), and are drawn at [1, 2, 4, 8, ...] × 5σrms, where σrms = 224.2 μJy beam−1.
Current usage metrics show cumulative count of Article Views (full-text article views including HTML views, PDF and ePub downloads, according to the available data) and Abstracts Views on Vision4Press platform.
Data correspond to usage on the plateform after 2015. The current usage metrics is available 48-96 hours after online publication and is updated daily on week days.
Initial download of the metrics may take a while.