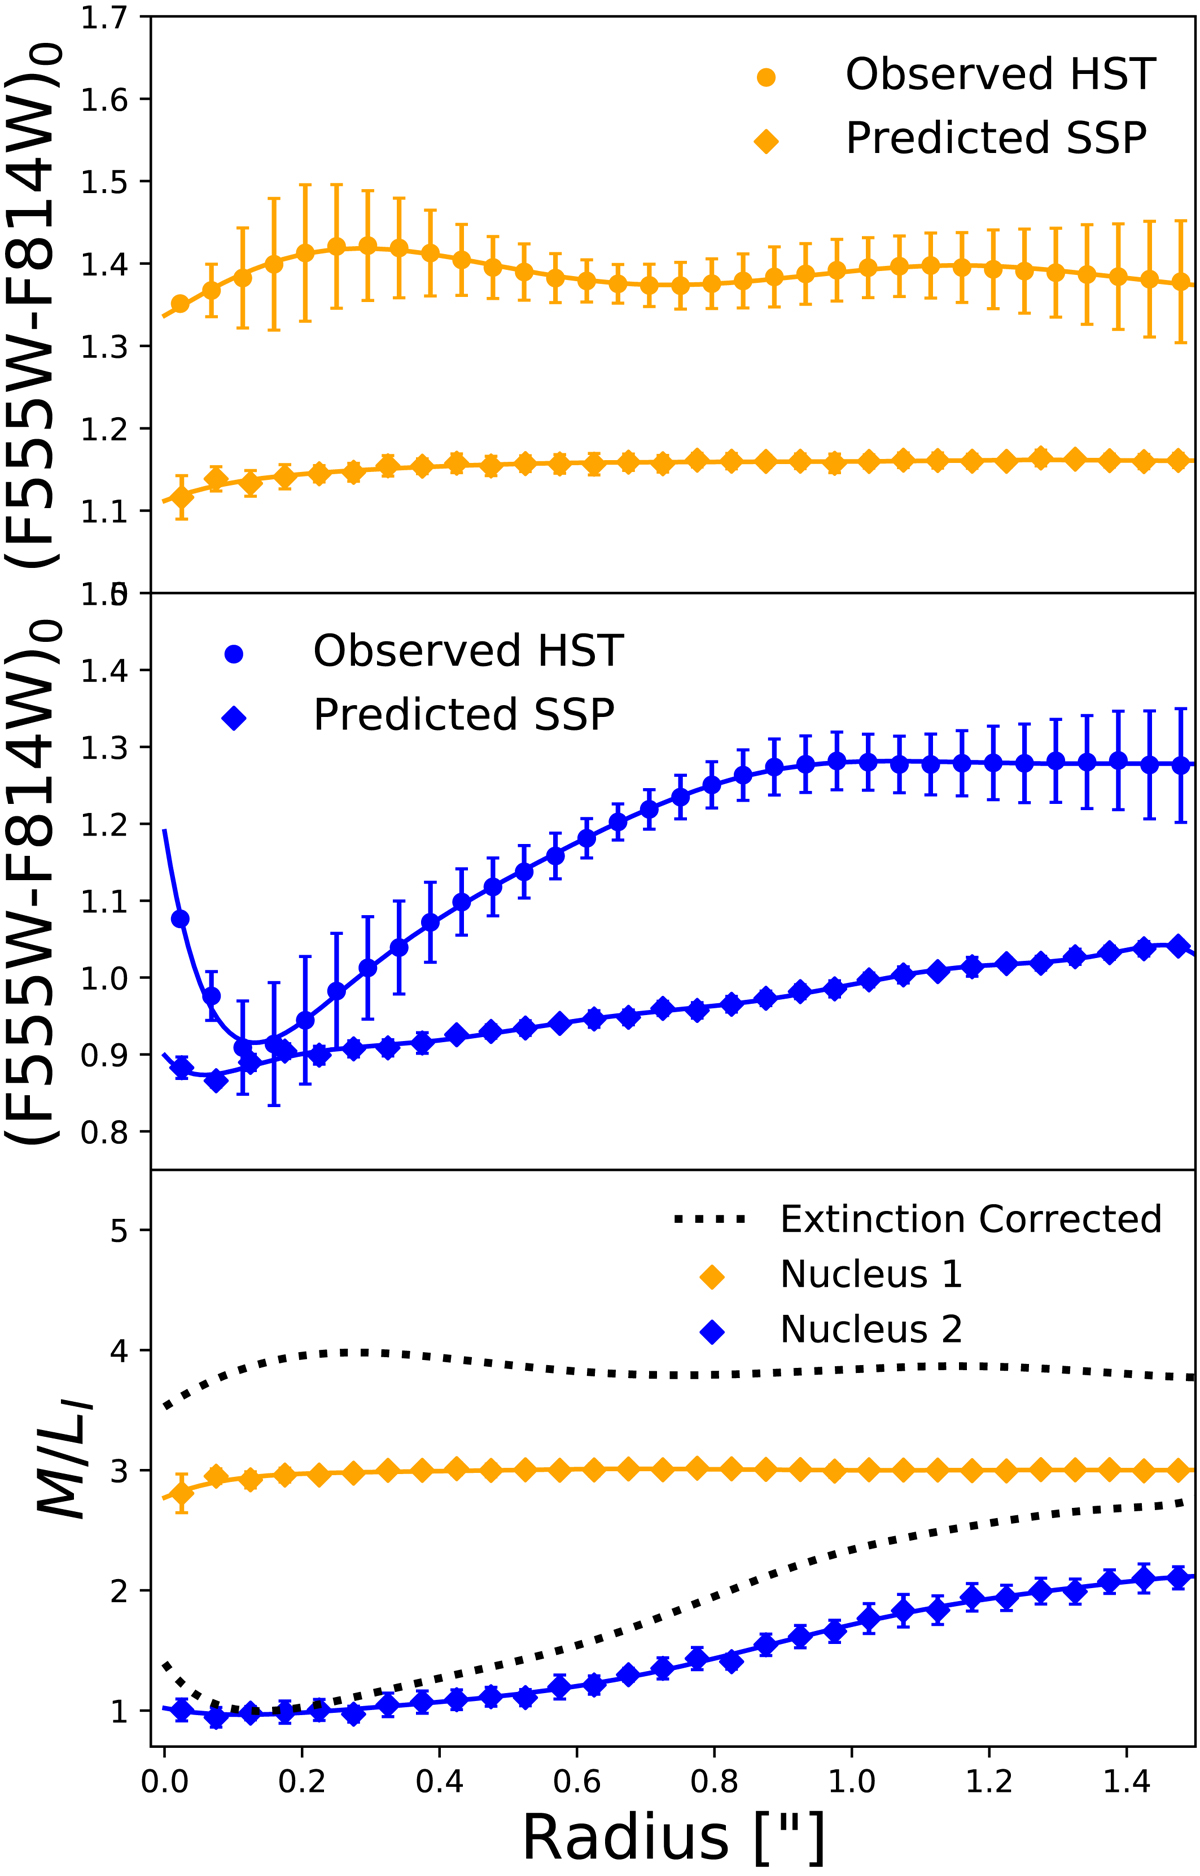
Fig. 6.
Download original image
Radial observed HST F555W–F814 color profiles are compared to the predicted color profiles in the top panel for Nucleus 1, and in the middle panel for Nucleus 2. The observed HST colors that were corrected for foreground extinction and PSF effects. The relative reddening of the observed profiles is used to calculate the radially dependent internal extinction of the two Nuclei. Bottom panel: colored diamond symbols are the predicted radial M/LI profiles for both nuclei, and the dashed black lines are the M/LI, eff profiles that have been corrected for internal extinction.
Current usage metrics show cumulative count of Article Views (full-text article views including HTML views, PDF and ePub downloads, according to the available data) and Abstracts Views on Vision4Press platform.
Data correspond to usage on the plateform after 2015. The current usage metrics is available 48-96 hours after online publication and is updated daily on week days.
Initial download of the metrics may take a while.