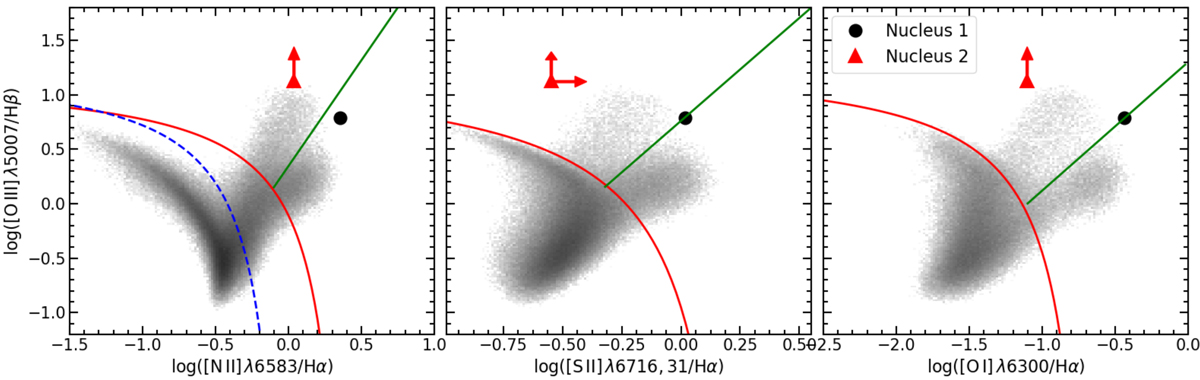
Fig. 14.
Download original image
Three diagnostic BPT diagrams for Nucleus 1 (black point) and Nucleus 2 (red triangle). The gray data points are taken from the SDSS DR7 MPA-JHU catalog of Brinchmann et al. (2004). The solid red line denotes the maximum location of starbursts by Kewley et al. (2001), the dashed blue line is the star-forming boundary suggested by Kauffmann et al. (2003), and the green line is the division between Seyfert galaxies and LINERS (Kewley et al. 2006).
Current usage metrics show cumulative count of Article Views (full-text article views including HTML views, PDF and ePub downloads, according to the available data) and Abstracts Views on Vision4Press platform.
Data correspond to usage on the plateform after 2015. The current usage metrics is available 48-96 hours after online publication and is updated daily on week days.
Initial download of the metrics may take a while.