Fig. 11.
Download original image
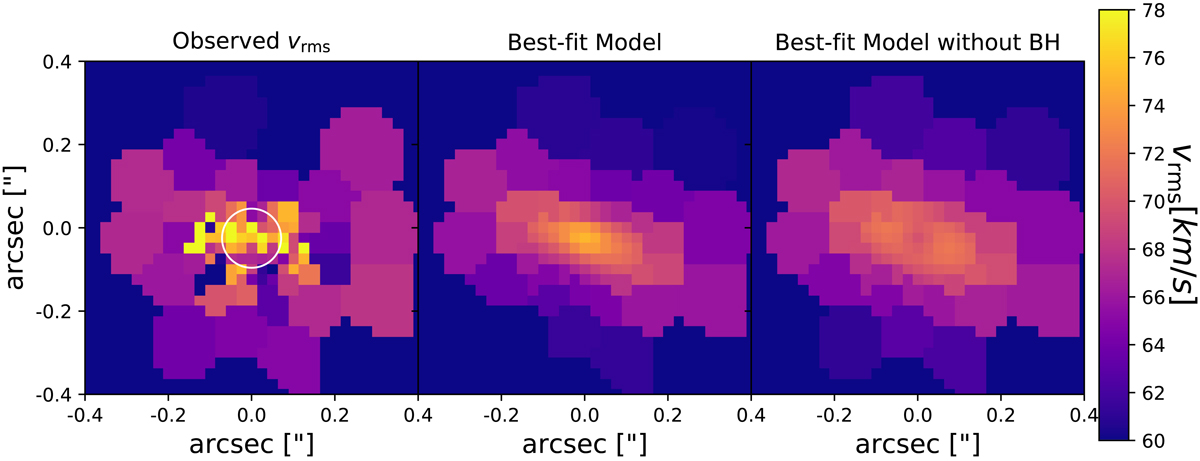
vrms maps centered on Nucleus 2. Left panel: observed MUSE map; in the middle is the best-fit model, and on the right is the same model but without a black hole. The white circle marks the SOI of 0.08″. The typical errors on the vrms values in the MUSE map are 4 km s−1, and thus while the observational scatter appears large it is consistent with the best-fit model in the center with a reduced χ2 of 1.6. We also note the small velocity scale of the colorer, which covers only 18 km s−1 to give sufficient contrast in displaying the models.
Current usage metrics show cumulative count of Article Views (full-text article views including HTML views, PDF and ePub downloads, according to the available data) and Abstracts Views on Vision4Press platform.
Data correspond to usage on the plateform after 2015. The current usage metrics is available 48-96 hours after online publication and is updated daily on week days.
Initial download of the metrics may take a while.