Fig. 6
Download original image
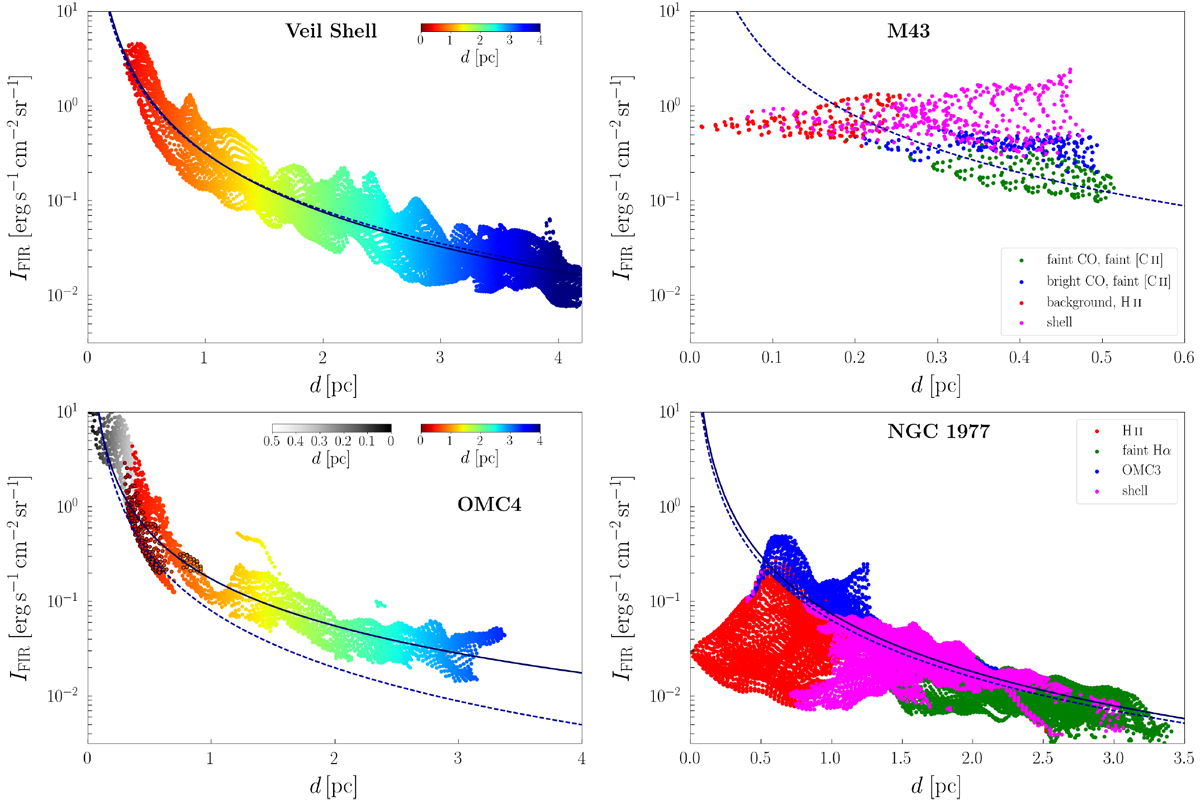
FIR intensity versus (projected) distance from respective central stars in M42 (top left: Veil Shell, bottom left: OMC4), M43 (top right) and NGC 1977 (bottom right). The division of M43 and NGC 1977 into the regions given in the legend is described in Sect. 3.2. The blue solid lines are the fits summarized in Table 1. The blue dashed lines indicate a FIR intensity scaling with d−2.
Current usage metrics show cumulative count of Article Views (full-text article views including HTML views, PDF and ePub downloads, according to the available data) and Abstracts Views on Vision4Press platform.
Data correspond to usage on the plateform after 2015. The current usage metrics is available 48-96 hours after online publication and is updated daily on week days.
Initial download of the metrics may take a while.