Free Access
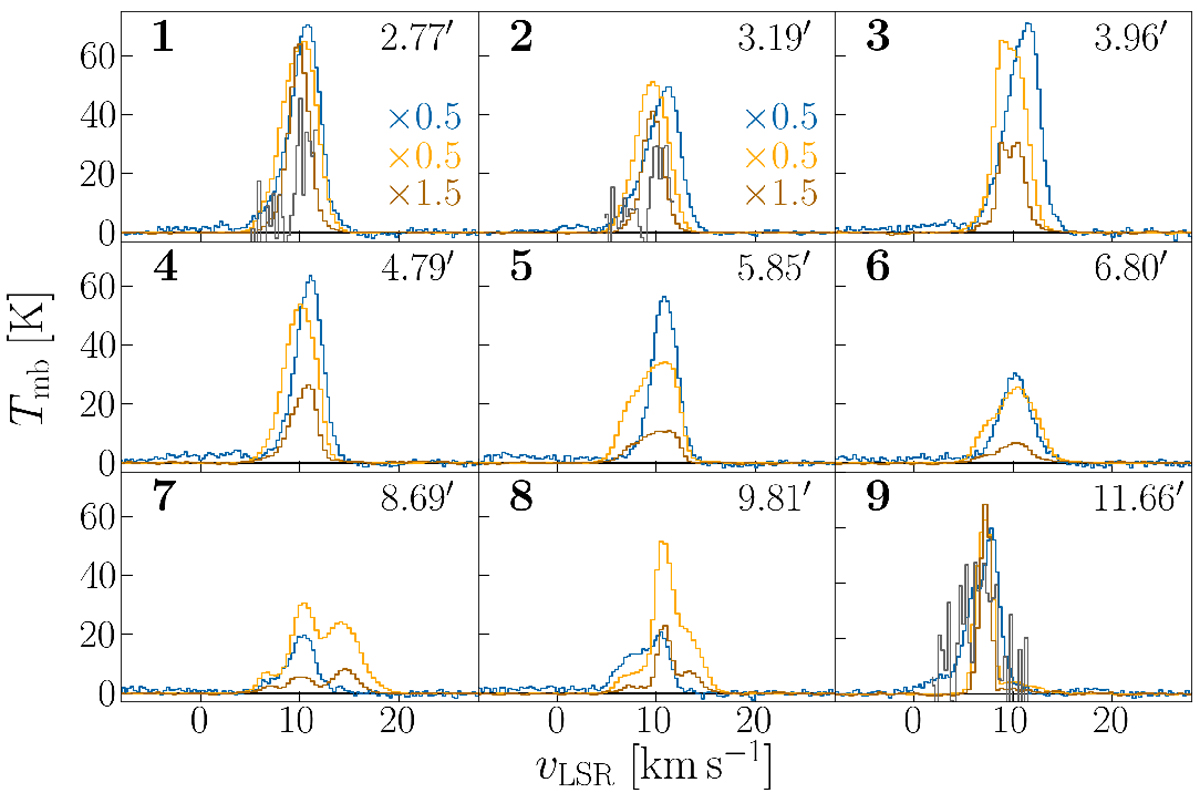
Fig. 24
Download original image
[C II] (blue), 12CO(2−1) (yellow), and 13CO (brown) spectra along the line cut behind the Orion Bar in Fig. 23. The offset with respect to θ1 Ori C is given in arcminutes. In addition, the [13C II] F = 2– 1 component is plotted (gray) in its systemic velocity and multiplied by 20 in spectra 1, 2, and 9.
Current usage metrics show cumulative count of Article Views (full-text article views including HTML views, PDF and ePub downloads, according to the available data) and Abstracts Views on Vision4Press platform.
Data correspond to usage on the plateform after 2015. The current usage metrics is available 48-96 hours after online publication and is updated daily on week days.
Initial download of the metrics may take a while.