Fig. 21
Download original image
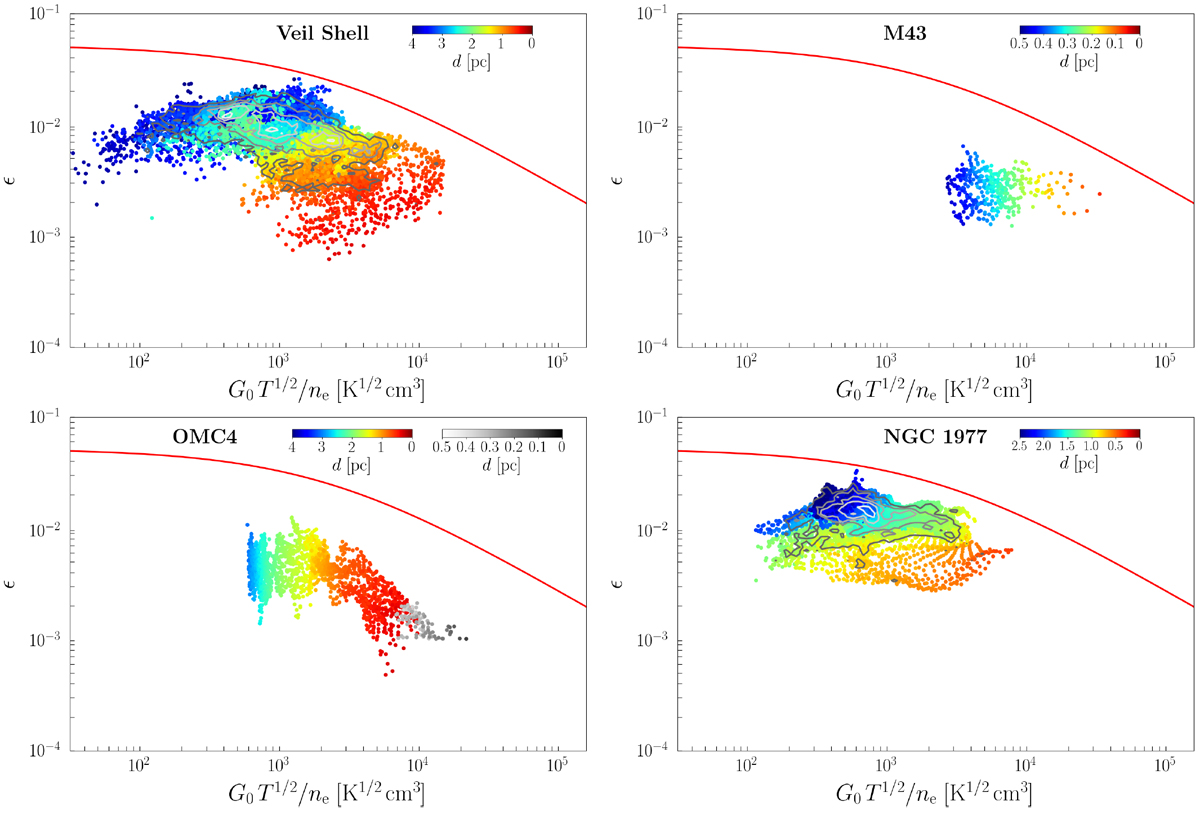
Photoelectric heating efficiency ϵ, equated as cooling efficiency [C II]/FIR, in M42 (top left: Veil Shell, bottom left: OMC4 with OMC1 (in gray scale)), the shell of M43 (top right), and the shell of NGC 1977 (bottom right) as function of the ionization parameter γ = G0 T1∕2∕ne. Colors indicate the distance from θ1 Ori C in the Orion Nebula, from NU Ori in M43, and from 42 Orionis in NGC 1977, respectively. Contours in the upper-left and lower-right panels indicate the density levels above which 90, 70, 50, 30, and 10% of the points lie. The red curve is the theoretical prediction of Eq. (43) by Bakes & Tielens (1994).
Current usage metrics show cumulative count of Article Views (full-text article views including HTML views, PDF and ePub downloads, according to the available data) and Abstracts Views on Vision4Press platform.
Data correspond to usage on the plateform after 2015. The current usage metrics is available 48-96 hours after online publication and is updated daily on week days.
Initial download of the metrics may take a while.