Fig. 15
Download original image
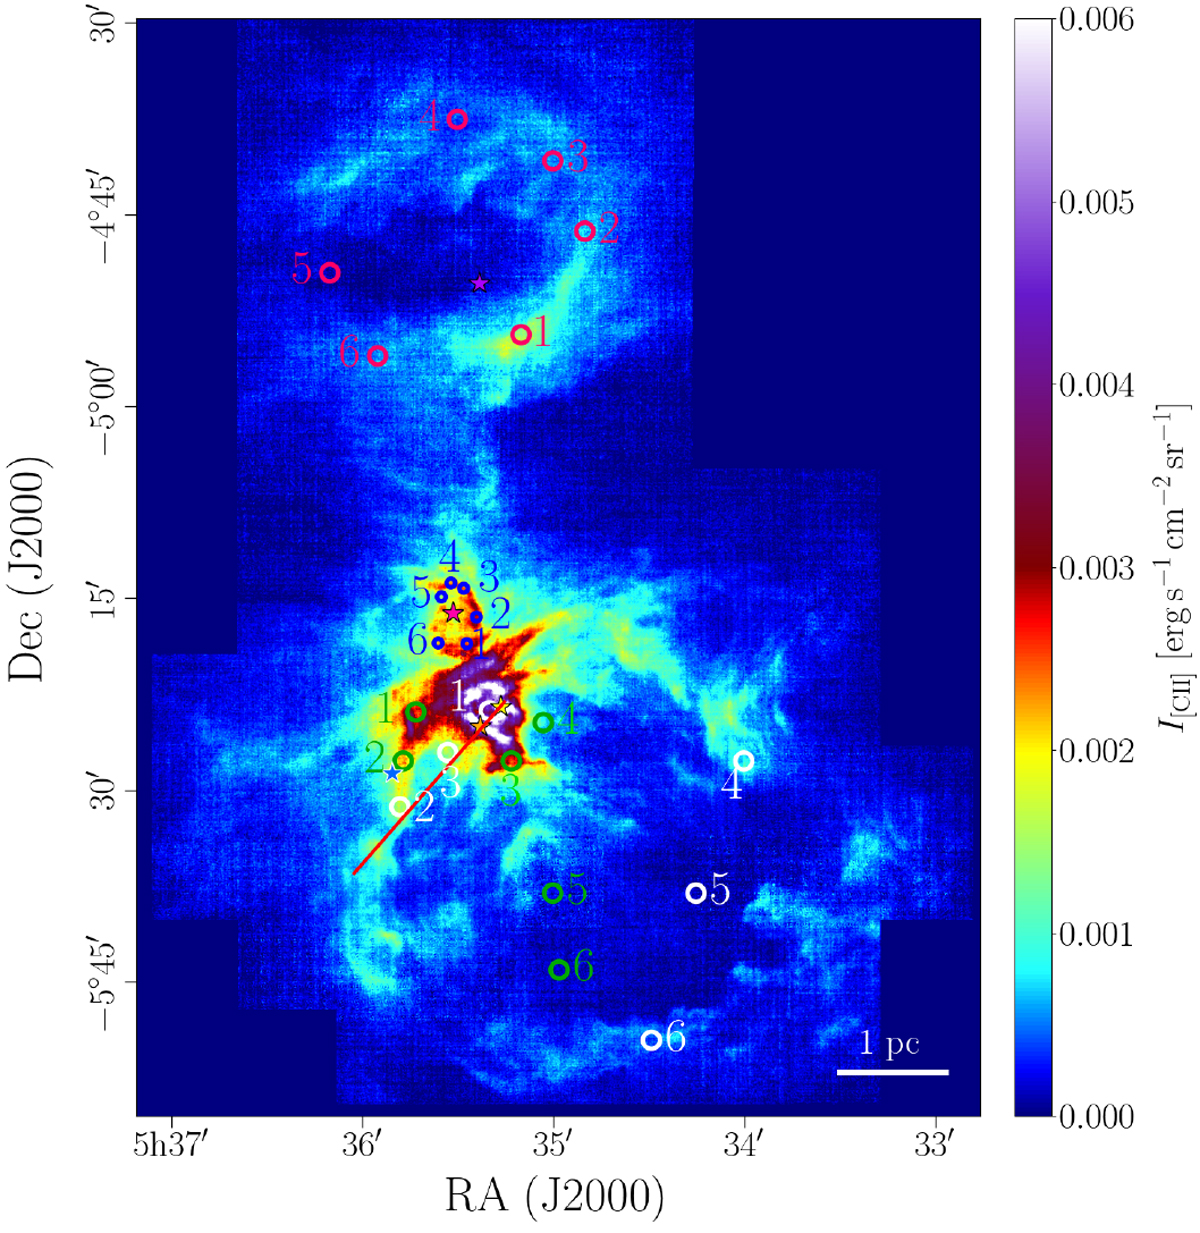
Positions of spectra (green and white circles: spectra in M42, blue: M43, red: NGC 1977) and line cut in Fig. 23 (red line) on [C II] line-integrated emission at its native resolution. The stars indicate the most massive stars within each region: θ1 Ori C (yellow) in M42, NU Ori (pink) in M43, and 42 Orionis (purple) in NGC 1977.
Current usage metrics show cumulative count of Article Views (full-text article views including HTML views, PDF and ePub downloads, according to the available data) and Abstracts Views on Vision4Press platform.
Data correspond to usage on the plateform after 2015. The current usage metrics is available 48-96 hours after online publication and is updated daily on week days.
Initial download of the metrics may take a while.