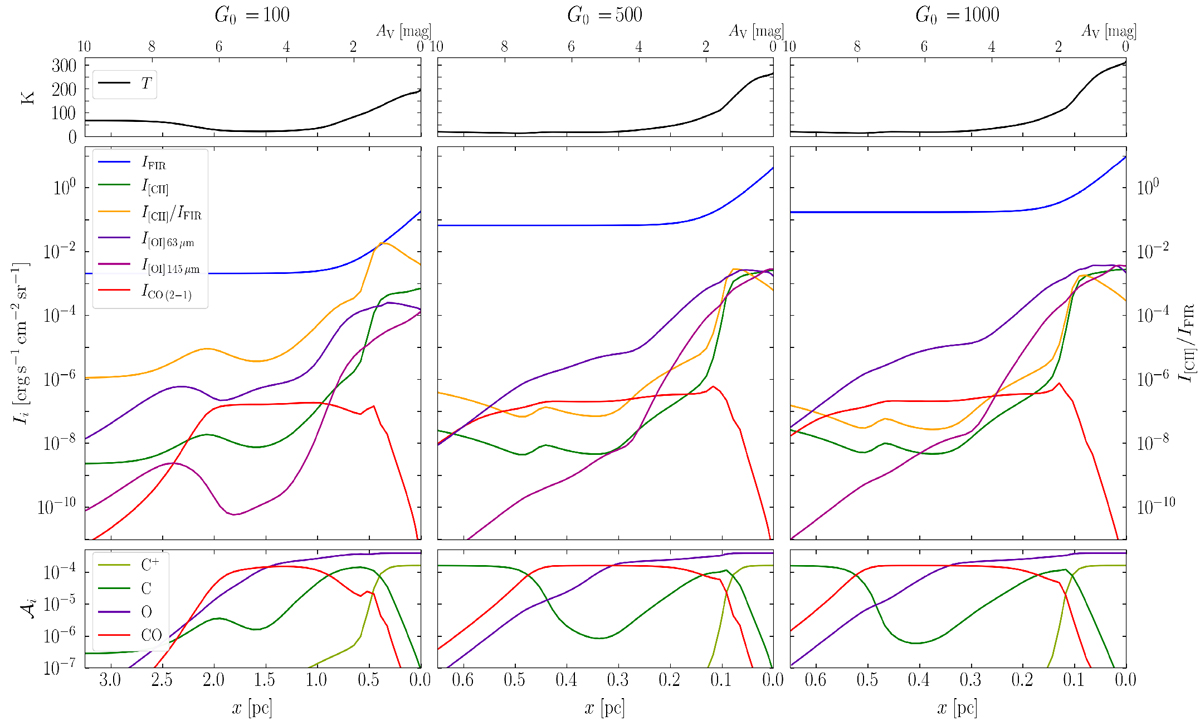
Fig. 13
Download original image
Results of our edge-on models described in Sect. 4.1 for incident FUV intensities of G0 = 100, 500, and 1000 on physical scale, illuminated from the right. The panels show the gas temperature T (upper panels), IFIR, I[C II], I[C II] ∕IFIR,, I[O I] 63 μm, I[O I] 145 μm, and ICO (2–1) (middle panels) and C+, C, O, and CO fractional abundances (lower panels) versus physical scale. The gas densities are nH = 2.0 × 103 cm−3, 1.0 × 104 cm−3, 1.0 × 104 cm−3 (left to right panels), and the respective line-of-sight depths are AV,los = 3, 10, 10. We note that I[CII]∕IFIR is a unitless ratio, whose value is given by the y-axis.
Current usage metrics show cumulative count of Article Views (full-text article views including HTML views, PDF and ePub downloads, according to the available data) and Abstracts Views on Vision4Press platform.
Data correspond to usage on the plateform after 2015. The current usage metrics is available 48-96 hours after online publication and is updated daily on week days.
Initial download of the metrics may take a while.