Fig. 9
Download original image
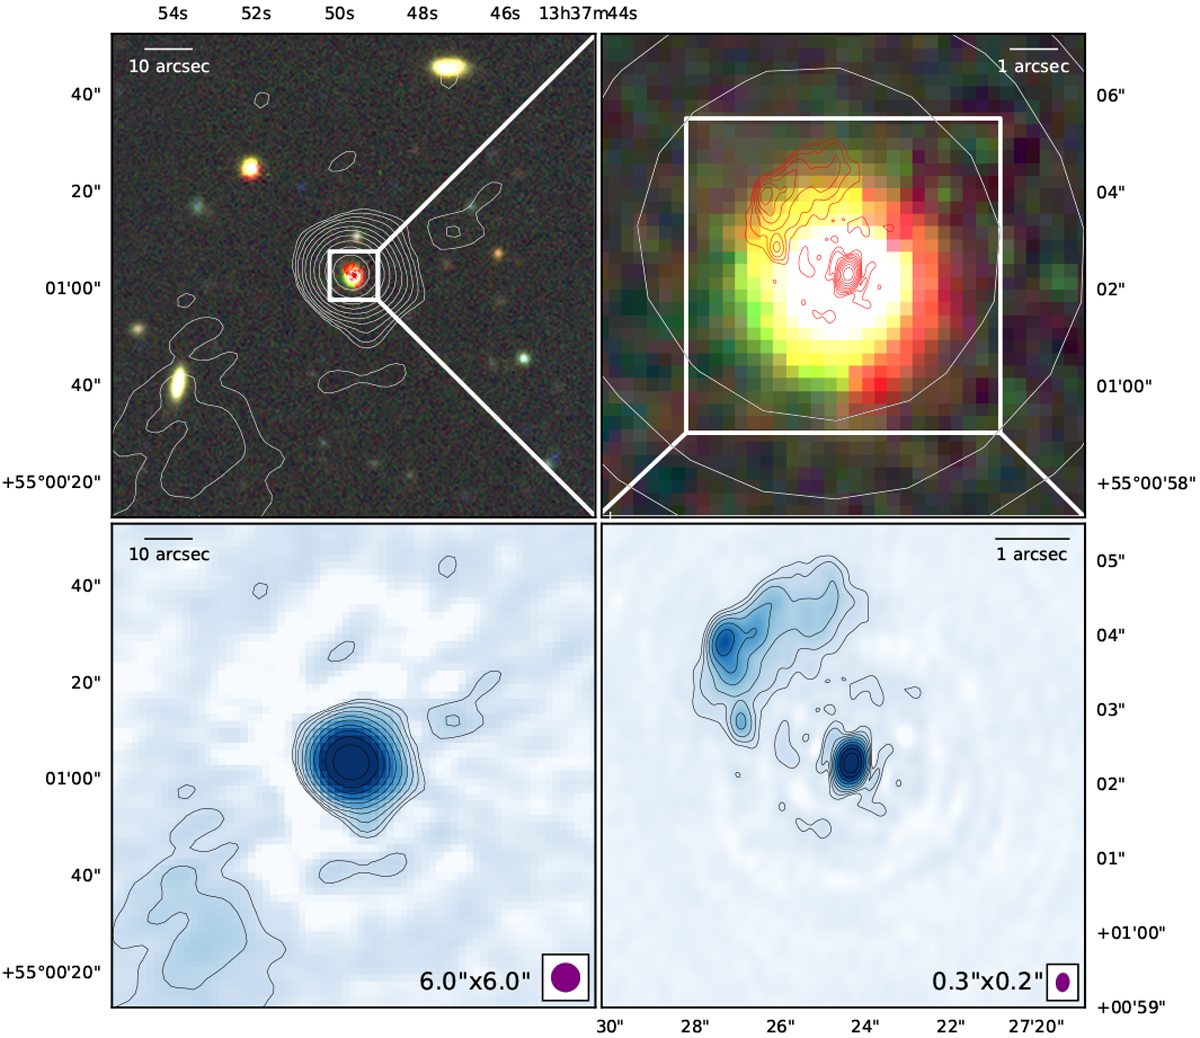
Delay calibrator source, ILTJ1337+5501. The background rgb image in the top panels is bands g, r, z from the Legacy Surveys (http://legacysurvey.org/viewer/). The white contours in the two top panels are from the DR2 processing ofthis field, while the red contours are the LOFAR-VLBI imaging of this source. The bottom left panel shows the DR2 image and contours, while the bottom right panel shows the LOFAR-VLBI image and contours. All contours start at 10σ
and increase by ![]() until either the data maximum is reached or nine levels have been drawn. The restoring beam for the radio images are shown in the bottom two plots.
until either the data maximum is reached or nine levels have been drawn. The restoring beam for the radio images are shown in the bottom two plots.
Current usage metrics show cumulative count of Article Views (full-text article views including HTML views, PDF and ePub downloads, according to the available data) and Abstracts Views on Vision4Press platform.
Data correspond to usage on the plateform after 2015. The current usage metrics is available 48-96 hours after online publication and is updated daily on week days.
Initial download of the metrics may take a while.