Fig. 6
Download original image
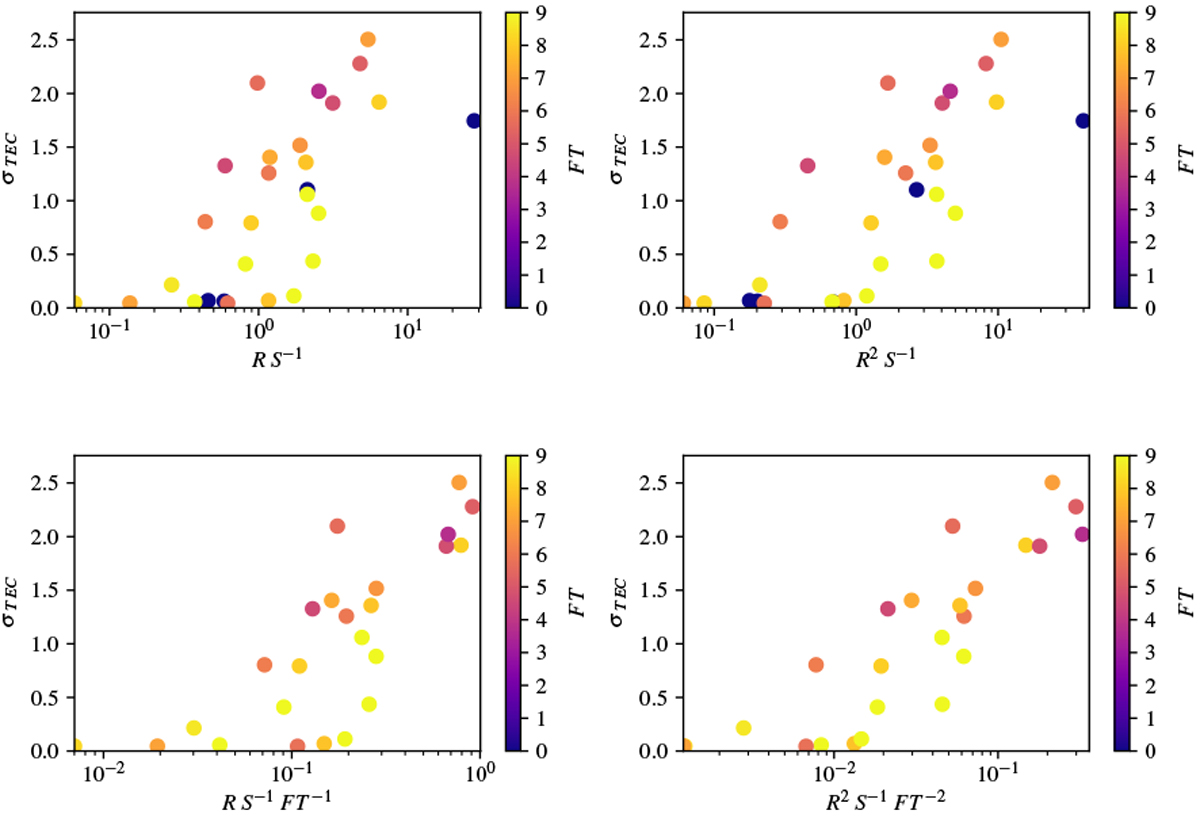
Different combinations of radius (R), flux density (S), and an LBCS goodness statistic (FT). Each data point is a different LBCS calibrator from a combination of five different observations. The independent variables on each plot are the different combinations, with the scatter in the solutions plotted as the dependent variable. The strongest correlation, and therefore best predictor for low scatter in TEC solutions, is seen in the bottom right panel.
Current usage metrics show cumulative count of Article Views (full-text article views including HTML views, PDF and ePub downloads, according to the available data) and Abstracts Views on Vision4Press platform.
Data correspond to usage on the plateform after 2015. The current usage metrics is available 48-96 hours after online publication and is updated daily on week days.
Initial download of the metrics may take a while.