Fig. 4
Download original image
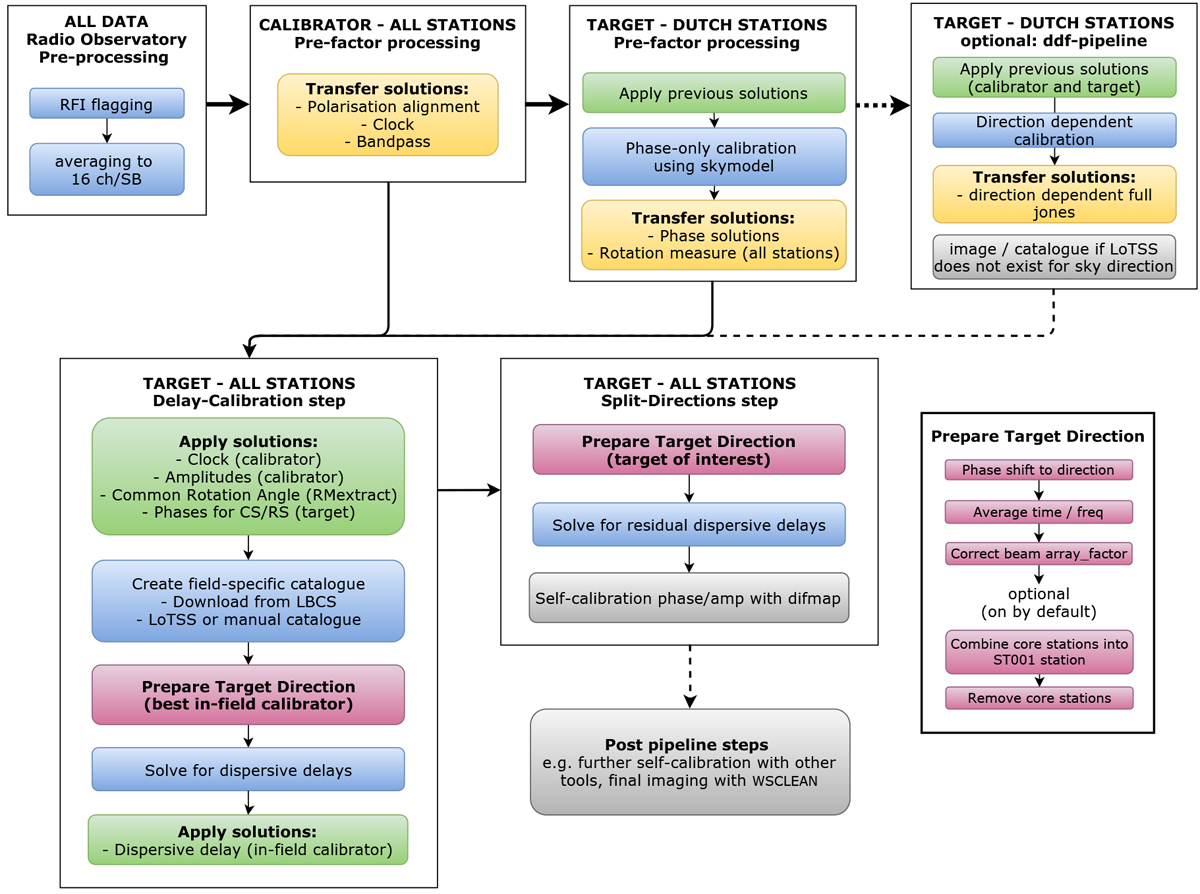
Block diagram overview of the calibration strategy. Each white box represents a different self-contained step in the process, starting with Radio Observatory Pre-processing, all the way to the Split-Directions step of the LOFAR-VLBI pipeline. Data products from previous boxes are used in the next box. At the top of each box the type of data and stations used are indicated in capital letters.
Current usage metrics show cumulative count of Article Views (full-text article views including HTML views, PDF and ePub downloads, according to the available data) and Abstracts Views on Vision4Press platform.
Data correspond to usage on the plateform after 2015. The current usage metrics is available 48-96 hours after online publication and is updated daily on week days.
Initial download of the metrics may take a while.