Fig. 3

Download original image
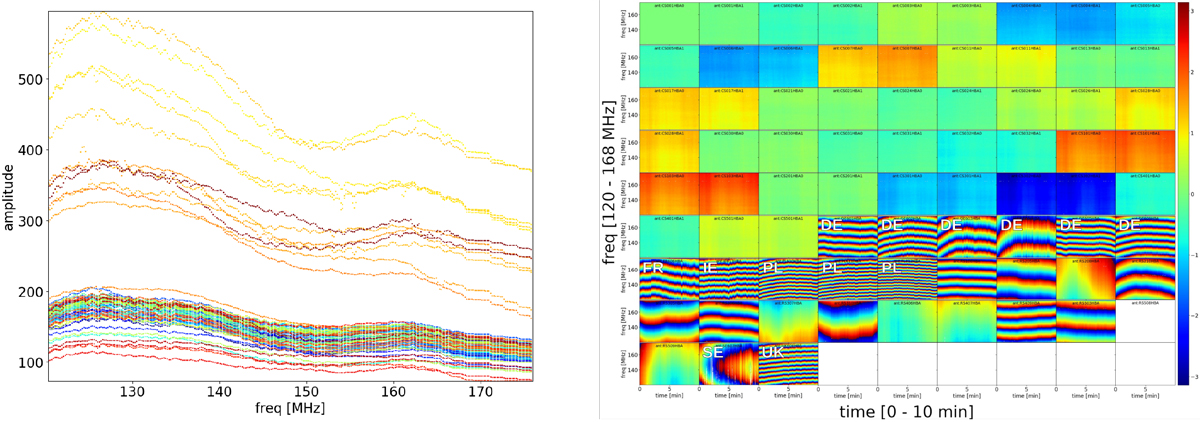
Calibrator solutions for 3C 147. These are two of the default plots generated by PREFACTOR. On the left are bandpass solutions for the XX polarisation. The international stations are those with values of ~ 300 or above, while the Dutch station bandpass values are clustered between 100 and 200. The amplitude values are a correction factor that fixes the data scale to be in units of Janskys. On the right are phase solutions for the XX polarisation, referenced to CS001HBA (top left corner). Each of the sub-panels in the right hand panel share the same axes: 0–10 min for the time axis, and 120–168 MHz for the frequency axis. It is clear that the core stations (CS) and remote stations (RS) have phases that are close to each other and vary slowly in frequency, while the international station phases (labelled with country codes DE, FR, SE, IR, PL, UK) show faster variation with frequency (in the vertical direction). The units of phase are radians.
Current usage metrics show cumulative count of Article Views (full-text article views including HTML views, PDF and ePub downloads, according to the available data) and Abstracts Views on Vision4Press platform.
Data correspond to usage on the plateform after 2015. The current usage metrics is available 48-96 hours after online publication and is updated daily on week days.
Initial download of the metrics may take a while.


