Fig. 16
Download original image
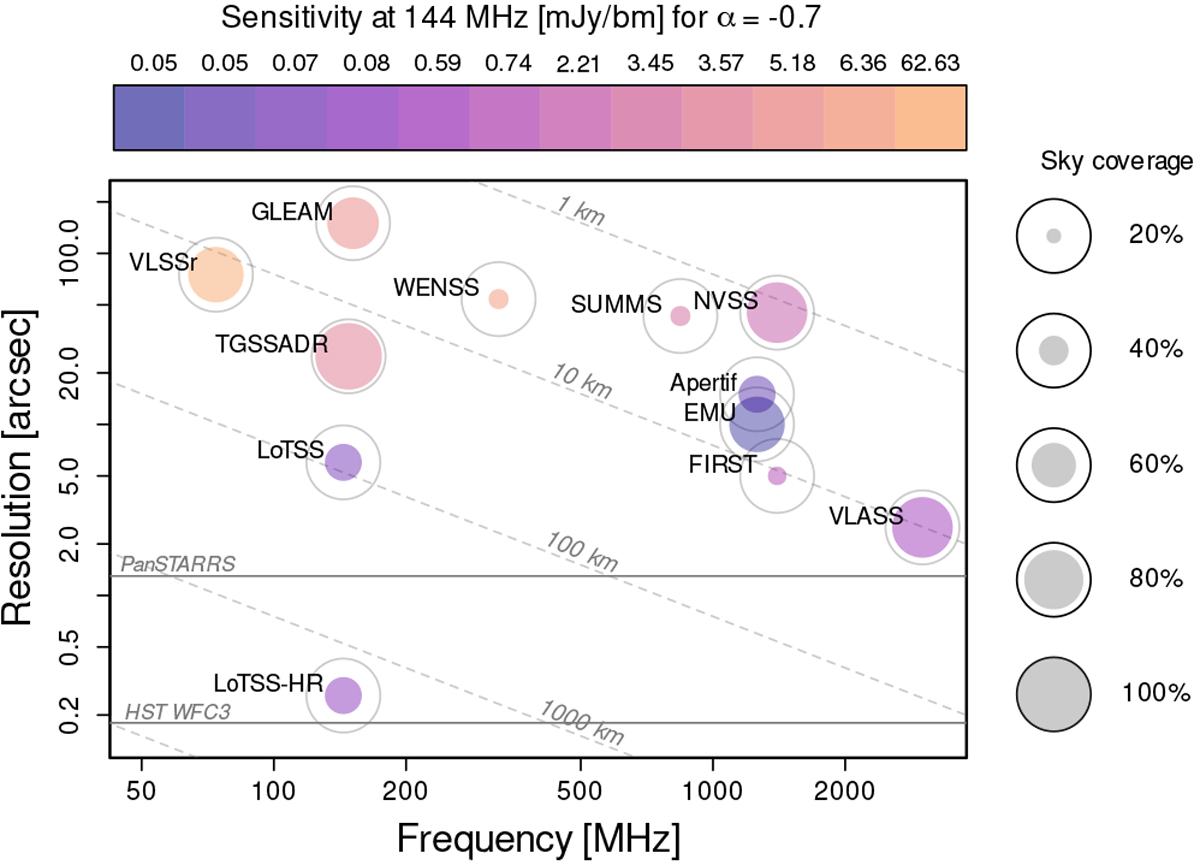
Comparison of resolution, sensitivity, and sky coverage of different radio surveys. The logarithmic x- and y-axes are frequency and resolution, respectively. The colour scale shows the relative survey sensitivity, having scaled the sensitivity ofeach survey to ν = 144 MHz assuming a typical synchrotron spectral index of α = −0.7. The circle outlines show 100% sky coverage, while the size of the coloured circles correspond to the percentage of the sky that will be covered by the survey; see the key on the right to guide the eye. Horizontal grey lines show typical resolutions of space (Hubble Space Telescope; HST) and ground-based (PanSTARRS) optical telescopes.
Current usage metrics show cumulative count of Article Views (full-text article views including HTML views, PDF and ePub downloads, according to the available data) and Abstracts Views on Vision4Press platform.
Data correspond to usage on the plateform after 2015. The current usage metrics is available 48-96 hours after online publication and is updated daily on week days.
Initial download of the metrics may take a while.