Fig. 12
Download original image
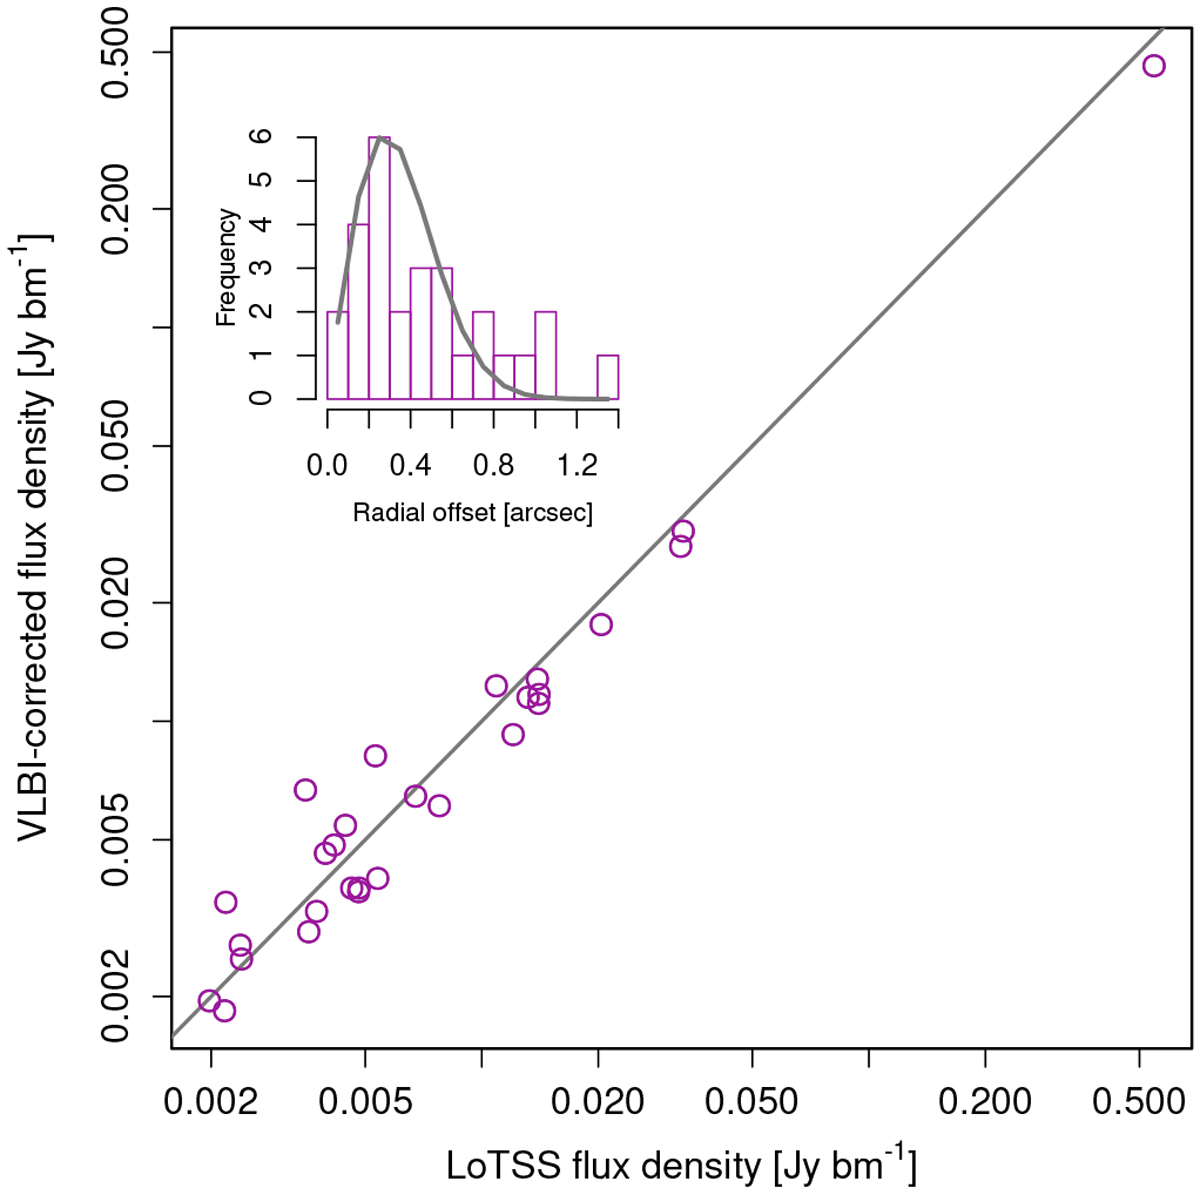
Flux density scale and astrometry checks, using the LoTSS DR2 image as a reference. There are 28 sources cross-matched between the LOFAR-VLBI corrected image and the reference LoTSS DR2 image. The large plot shows the integrated flux densities of these sources plotted against each other, with a line of equal flux density to guide the eye. The inset plot shows the astrometric precision. The histogram is the distribution of radial offsets of the difference in angular positions of the sources, in arcseconds. The grey line is a Rayleigh distribution with parameter s = 0.28′′ that describes the radial offsets well.
Current usage metrics show cumulative count of Article Views (full-text article views including HTML views, PDF and ePub downloads, according to the available data) and Abstracts Views on Vision4Press platform.
Data correspond to usage on the plateform after 2015. The current usage metrics is available 48-96 hours after online publication and is updated daily on week days.
Initial download of the metrics may take a while.