Fig. 11
Download original image
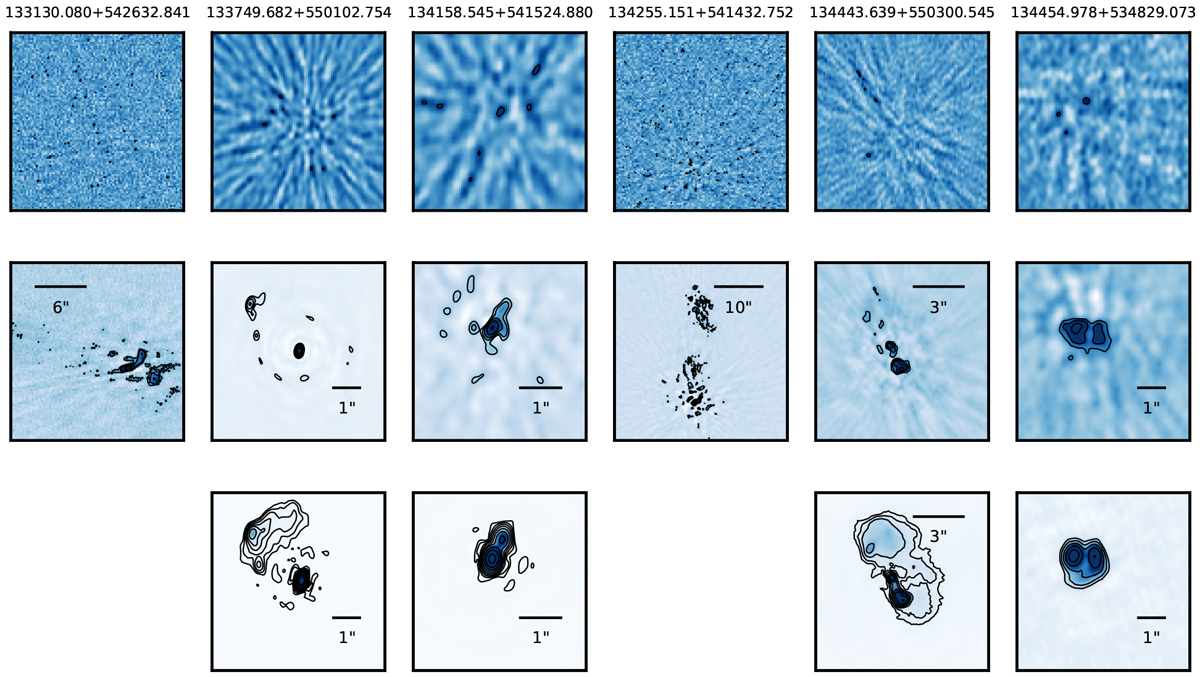
Images of the six LBCS calibrators (including the delay calibrator) within 1.5° of the phase centre and having a combined FT Goodness value >4. Each column is one LBCS calibrator. An angular scale bar is shown for each column rather than absolute coordinates as the astrometry has not yet been corrected. The image sizes are consistent within a column, but vary from column to column based on the size of the source. Top row: DOI for each source with only the dispersive delay from the calibrator applied; we do not expect to see sources here as the data are not phase-calibrated. Middle row: DOIs with solutions from the delay calibrator (which is the second column from the left) applied. These solutions include residual dTEC, DIFMAP self-calibration and complex gain solutions. Bottom row: DOIs after self-calibration in the same manner as the delay calibrator, starting from models made using the images in the middle row. Two sources with clearly extended emission are not treated as LBCS calibrators and thus do not have a final self-calibrated image in the bottom row of this figure. Contours in the middle (bottom) row start at 3σ
(10σ) from the image noise and increase by ![]() to 0.8 × (data maximum value), with a limit of the five lowest contours plotted. The colour scale in each image has a linear stretch from
− 5σ
to the meanof the contour levels.
to 0.8 × (data maximum value), with a limit of the five lowest contours plotted. The colour scale in each image has a linear stretch from
− 5σ
to the meanof the contour levels.
Current usage metrics show cumulative count of Article Views (full-text article views including HTML views, PDF and ePub downloads, according to the available data) and Abstracts Views on Vision4Press platform.
Data correspond to usage on the plateform after 2015. The current usage metrics is available 48-96 hours after online publication and is updated daily on week days.
Initial download of the metrics may take a while.