Fig. 10
Download original image
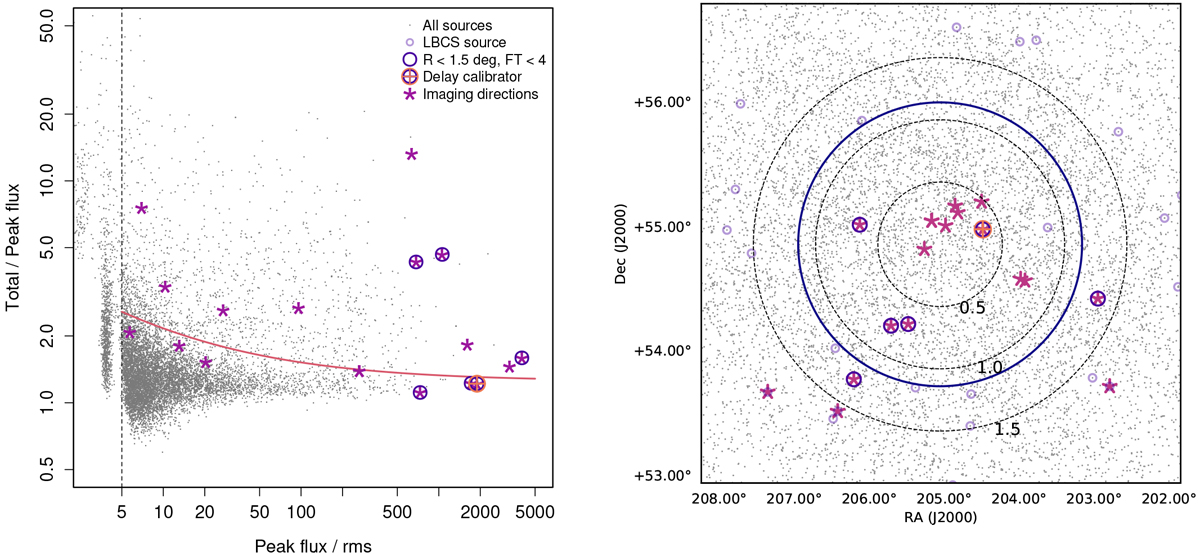
Source properties for the field. Left panel: LoTSS total-to-peak flux density ratio as a function of peak flux density/rms noise. The solid orange curve shows the division between resolved and unresolved sources (as in Shimwell et al. 2019, Sect. 3.1). The vertical dashed black line represents a signal-to-noise ratio of 5. Right panel: sky distribution of the sources in the centre of the field, with dotted lines at 0.5°, 1.0°, and 1.5° radii. The solid blue circle at a radius of 1.14 denotes where the intensity losses are expected to be 50% due to bandwidth and time smearing. In both panels, all sources detected in the DDF-PIPELINE catalogue are plotted as grey points, with LBCS sources marked with purple circles. The darker, larger purple circles show LBCS sources within 1.5° of the phase centre and having a combined FT Goodness value >4. The delay calibrator is marked with an orange cross-hair. Directions of interest (DOIs) are marked by the star symbols.
Current usage metrics show cumulative count of Article Views (full-text article views including HTML views, PDF and ePub downloads, according to the available data) and Abstracts Views on Vision4Press platform.
Data correspond to usage on the plateform after 2015. The current usage metrics is available 48-96 hours after online publication and is updated daily on week days.
Initial download of the metrics may take a while.