Open Access
Fig. 9
Download original image
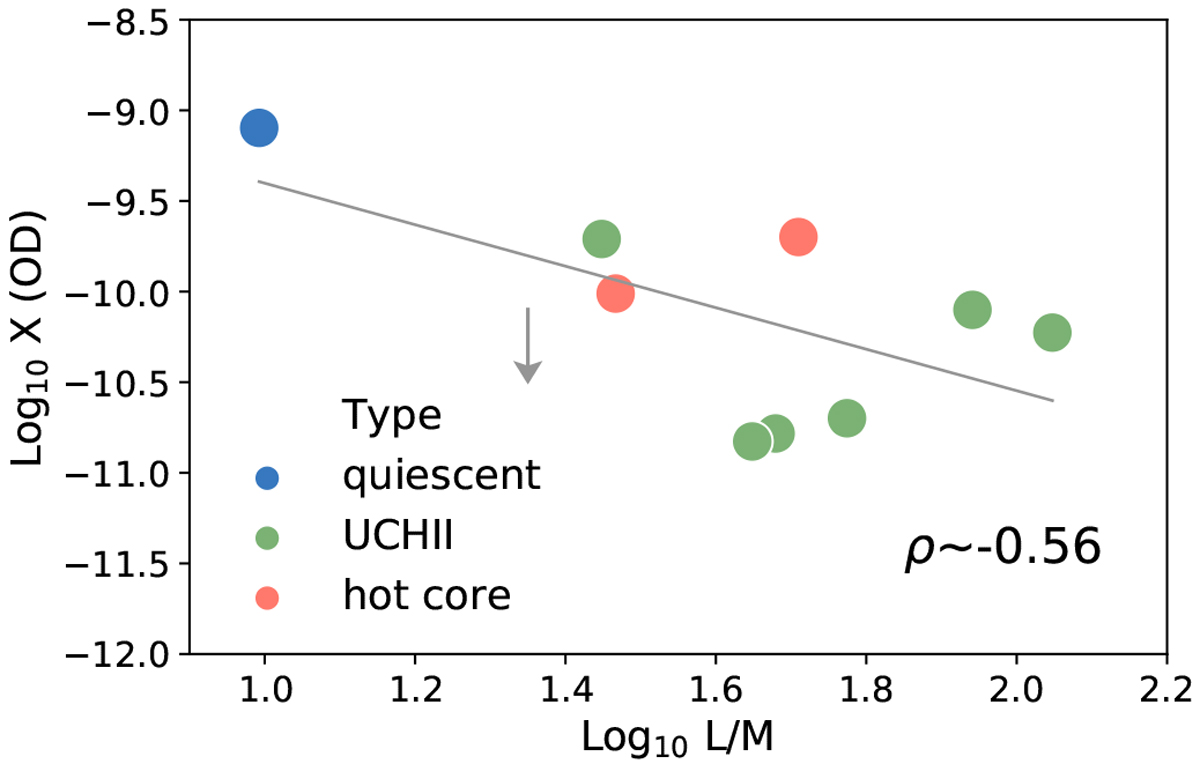
Observed OD abundance (X(OD)) versus Lbol∕M ratio for the entire sample. The colors show the different source types. The grey arrow marks the upper limit estimated for the non-detection of the quiescent source, G34.41. The Pearson correlation coefficient (ρ) is labelled in the figure.
Current usage metrics show cumulative count of Article Views (full-text article views including HTML views, PDF and ePub downloads, according to the available data) and Abstracts Views on Vision4Press platform.
Data correspond to usage on the plateform after 2015. The current usage metrics is available 48-96 hours after online publication and is updated daily on week days.
Initial download of the metrics may take a while.