Fig. 6
Download original image
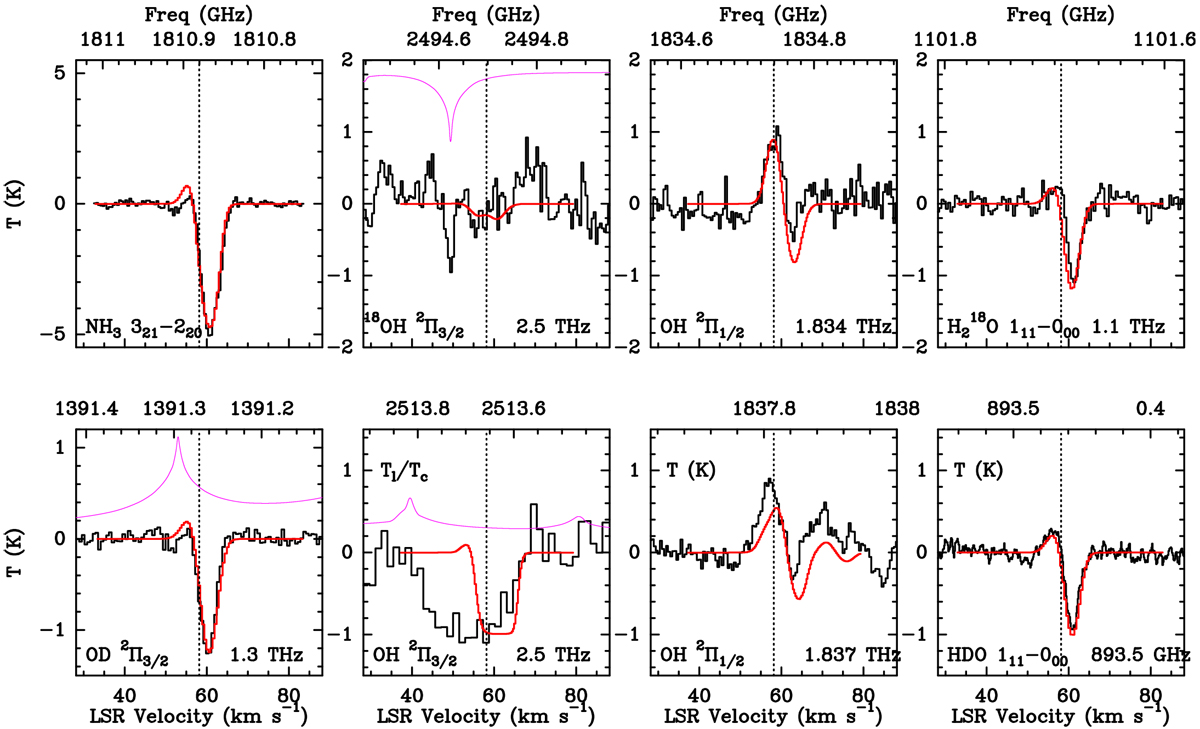
Observed spectra towards G34.25+0.15 are shown in black, and the red line shows the fitted RATRAN model (model A). Dotted line marks the vlsr of the source. Magenta line shows the atmospheric transmission, where the absorption feature in the 18OH spectrum around 50 km s−1 is due to a deliberately uncorrected telluric ozone feature.
Current usage metrics show cumulative count of Article Views (full-text article views including HTML views, PDF and ePub downloads, according to the available data) and Abstracts Views on Vision4Press platform.
Data correspond to usage on the plateform after 2015. The current usage metrics is available 48-96 hours after online publication and is updated daily on week days.
Initial download of the metrics may take a while.