Fig. 4
Download original image
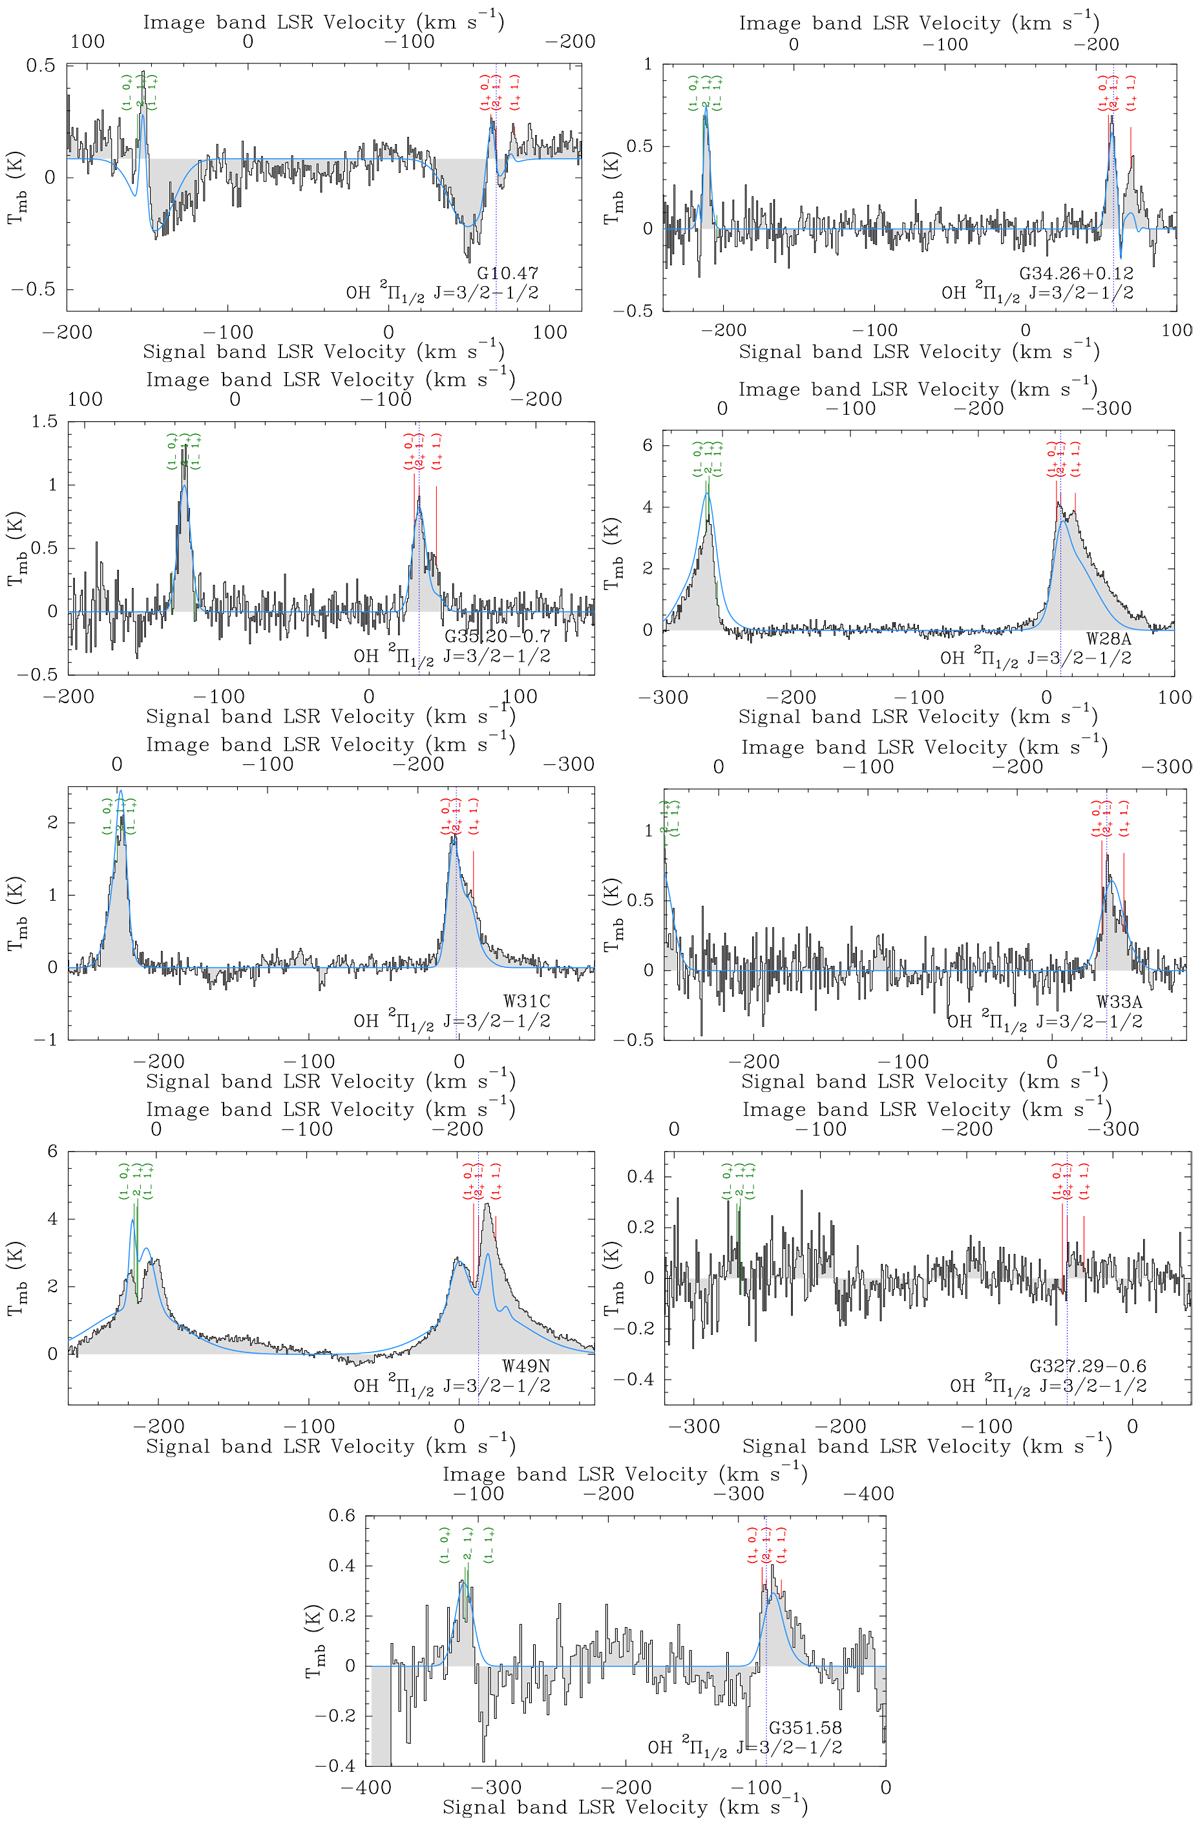
Overview of OH 2Π1∕2 (J = 3∕2−1∕2) transition towards the sample. The blue dotted line marks the systemic LSR velocity of the source in the signal band. The positions of the hfs lines are labelled in red in the signal and in green in the image band. The HFS fit to the spectra is shown in light blue. The velocity resolution is 0.75 km s−1 for all sources, except for G351.58−0.4, where we show the spectrum at a velocity resolution of 1.5 km s−1.
Current usage metrics show cumulative count of Article Views (full-text article views including HTML views, PDF and ePub downloads, according to the available data) and Abstracts Views on Vision4Press platform.
Data correspond to usage on the plateform after 2015. The current usage metrics is available 48-96 hours after online publication and is updated daily on week days.
Initial download of the metrics may take a while.